F1 – Optimize Gamma HV
Gem-5 User’s Manual 83
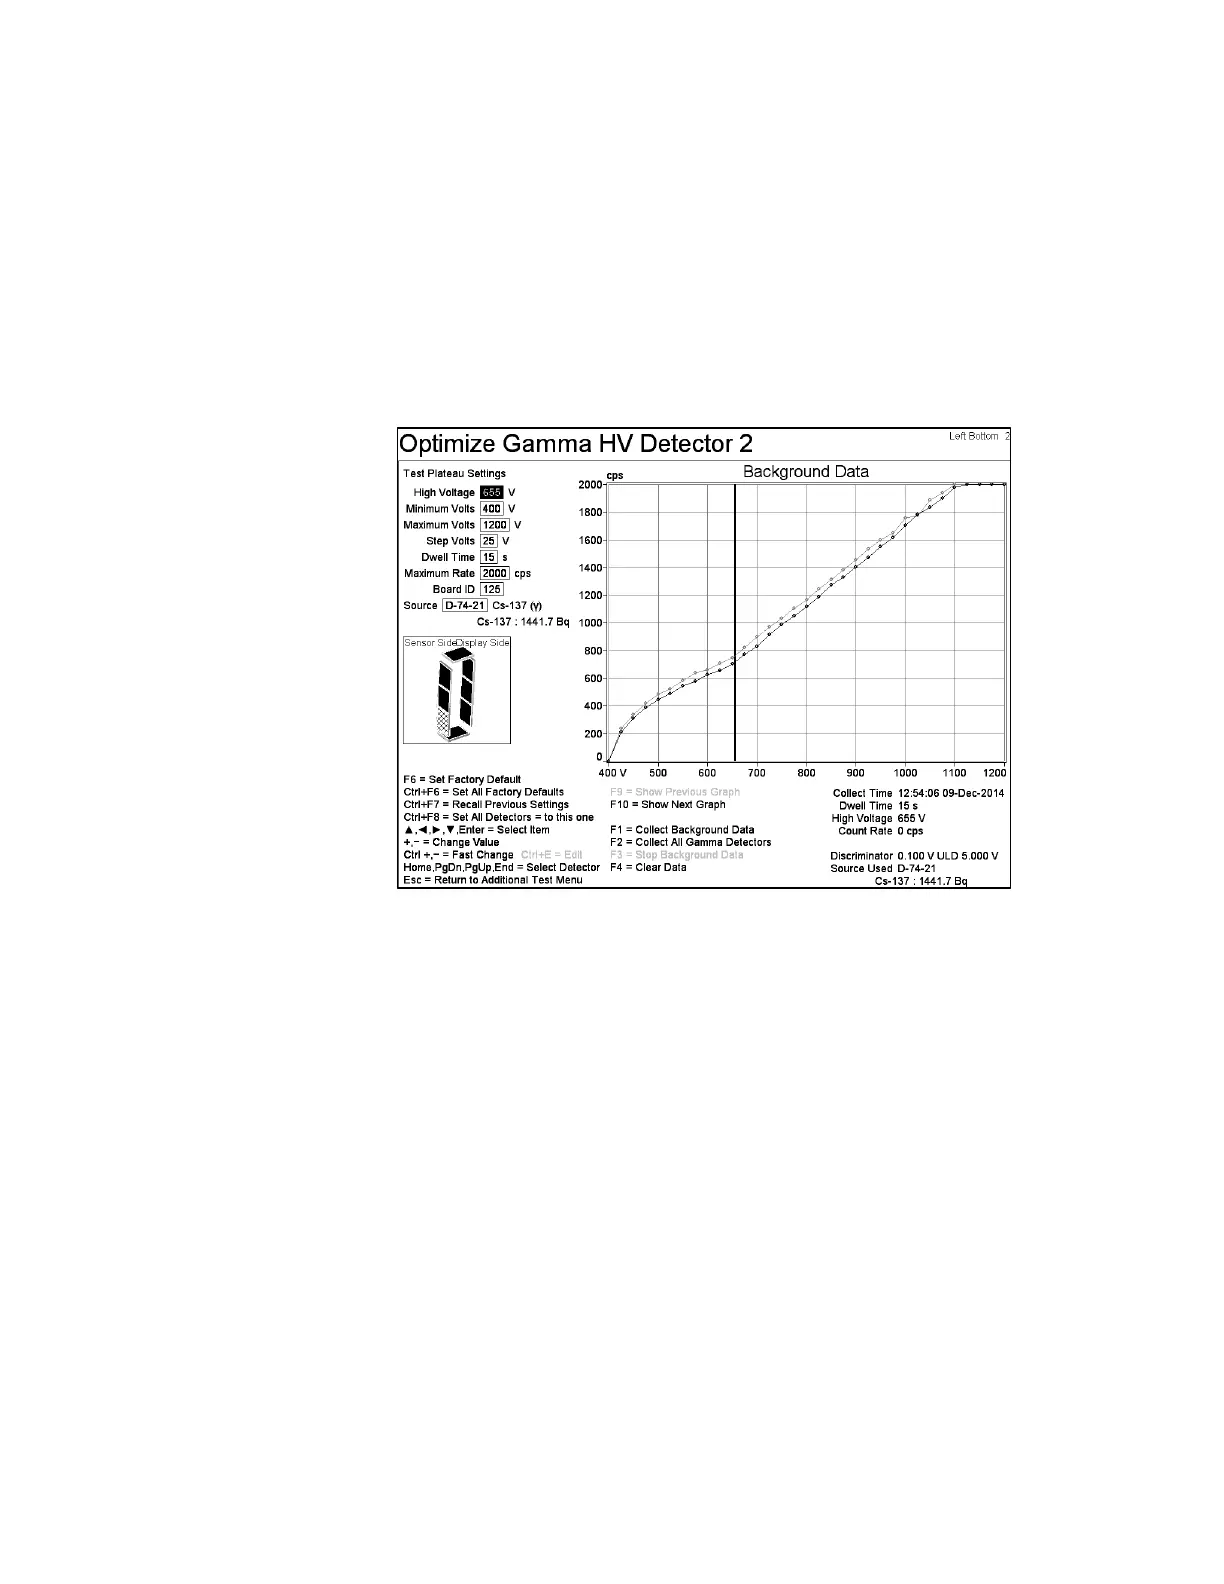
Gamma HV. The Background Data screen is displayed. Note that the Graph Title
(Background Data, Source Data, Figure of Merit, Efficiency, and Monitor Time) is at
the top of graph. The Monitor Time graph has a square root based vertical scale to
better highlight the minimum count time. In addition, the vertical scale units are at
the top of all graphs.
Upon opening the screen the high voltage for all detectors are turned on and
stabilized. Messages “Ramping HV” and “Stabilizing Detector” are shown on top
right of graph and the former appears until HV is ramped for all detectors (or 30 s
elapses). The latter appears for 5 s (after HV is ramped).
Figure 43 The Optimize Gamma HV Screen, Background Data
Proceed as follows:
1. Remove all Gamma Sources.
2. Press F2 = Collect All Gamma Detectors (this will collect background on all
detectors in the unit).
3. Wait for collection to finish, ~8.3 minutes at default settings.
4. Press F10 = Show Next Graph to view Source Data screen.