DMTA-10040-01EN, Rev. E, February 2018
Chapter 5278
8. Use the knob to select the RFT Erosion and Corrosion application, and press
to accept.
The overlay is displayed with the previous calibration settings on the screen (see
Figure 5-219 on page 278).
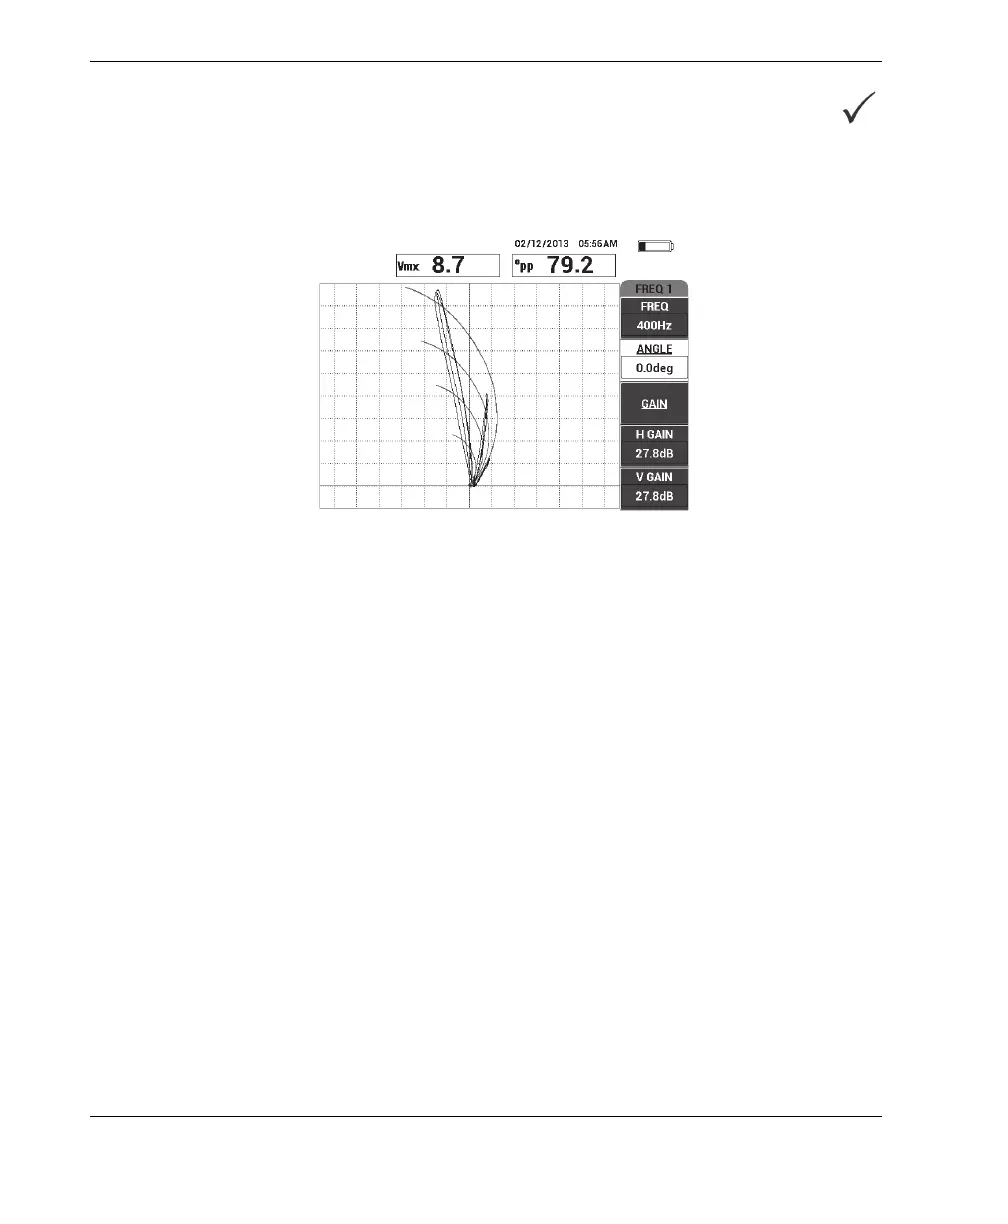
Figure 5‑219 The overlay (background voltage plane for absolute RFT signal
analysis) and the scan of the tube
5.4.4.3 Optimizing the Frequency
In remote-field testing, the optimal frequency is the one that gives you 1 degree per
percent of loss. You can check your calibration to ensure that the optimal frequency
has been chosen.
In the example calibration shown in Figure 5-220 on page 279, the angle peak-to-peak
(°pp) reading of the 60 % OD flaw is subtracted from the angle peak-to-peak (°pp)
reading of the 40 % OD flaw:
105.1° − 84.6° = 20.5°
This 20.5° value is close to the (60 − 40 = 20 %) loss value and therefore provides the
desired ratio of 1 degree per percent of loss.