QUALITY CONTROL, QC Methods/Application, X M Control
6-50 Sysmex SF-3000 Operator's Manual -- Revised September 1995
Sample 5 8 8 - 2 - 1. 4 1
Sample 4 9 5 5 2. 2 4
Sample 3 8 4 - 6 - 2. 4 5
Sample 2 8 4 - 6 - 2. 4 5
Sample 1 9 2 2 1. 4 1
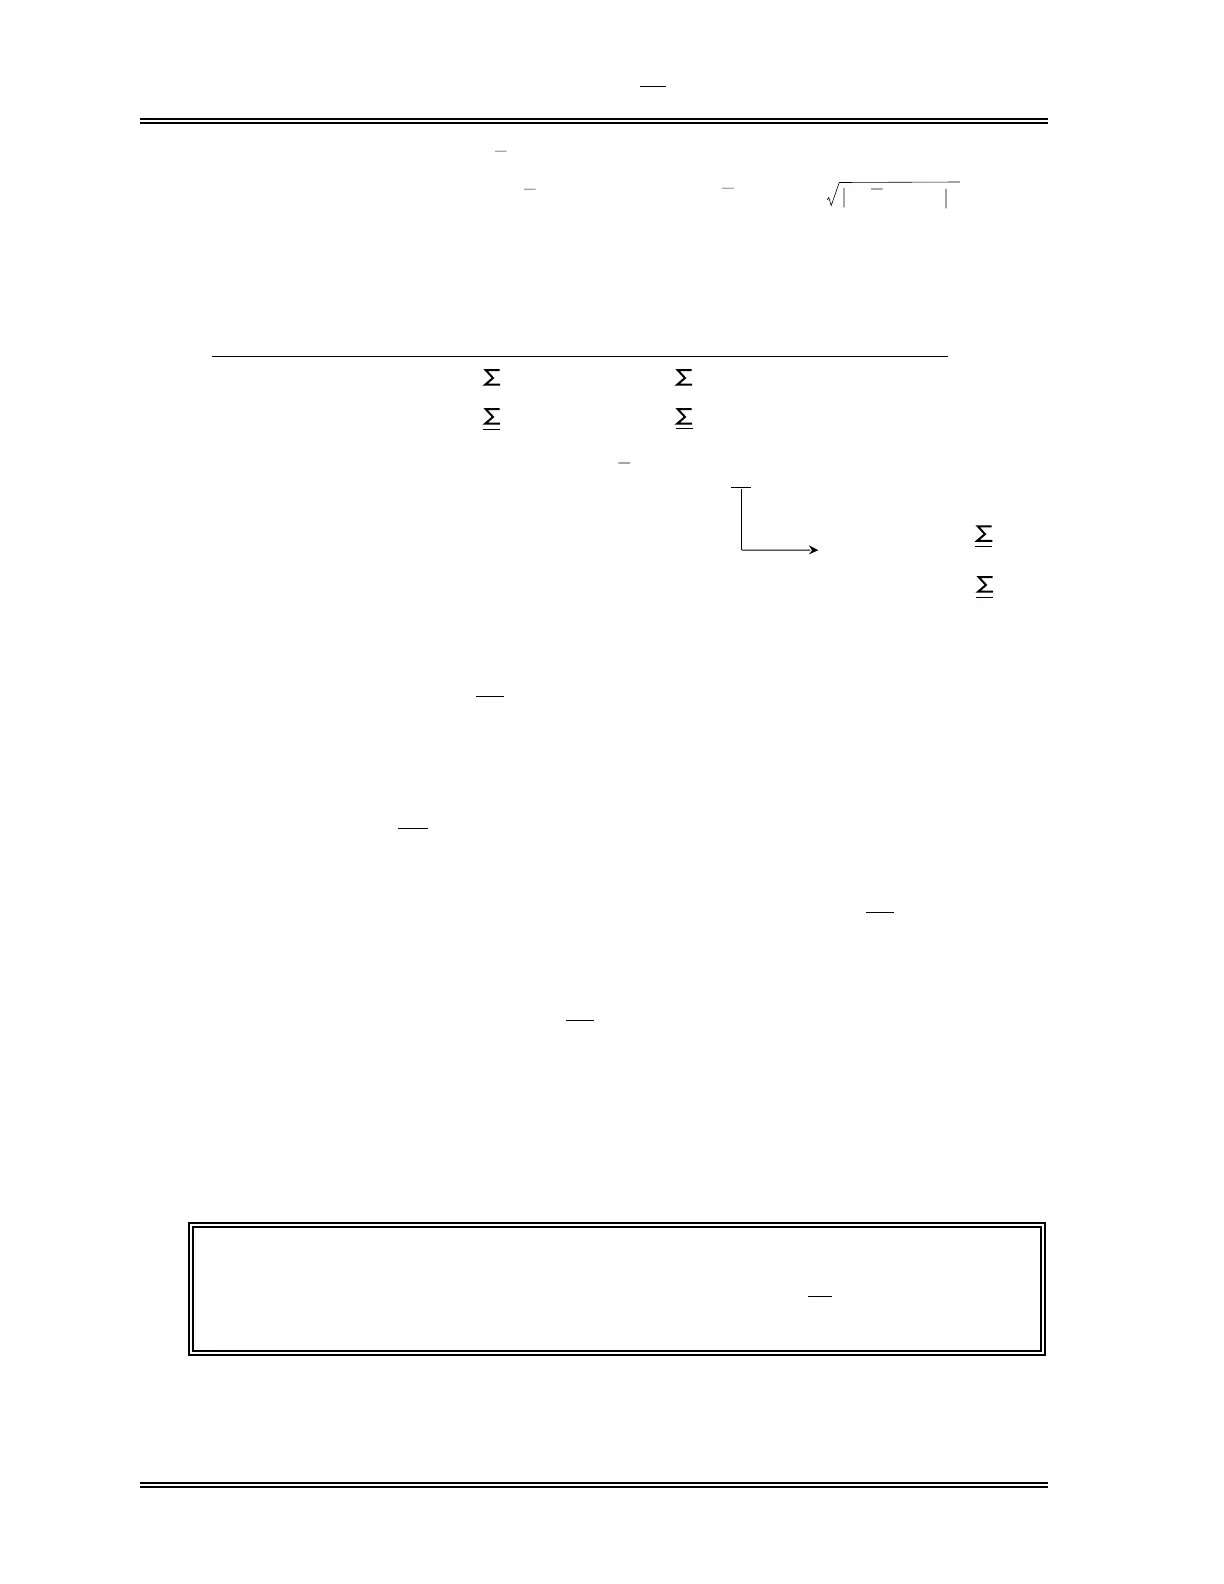
Current Batch Xj Xj-XM (i-1) SGN (Xj-XM (i-1) ) Xj-XM (i-1)
N = 5 = - 7 = - 2. 6 6
X = 9 0 - 1. 4 0 = 8 8. 6 0
XM ( i ) = 9 0 - ( - 0. 5 3 ) = 8 9. 7 2
2
Previous MCV batch average XM (i - 1) = 9 0
= - 1. 4 0
N
= - 0. 5 3
N
< 0
N
Negative when
Positive when
0
N
>
=
Figure 6-42: Equation (3)
The average provided by the X M Control method is closer to the previous batch
average than would be the case if an arithmetic mean were used. Thus the smoothing
procedure makes more practical use of the data.
* Limitations of X M Control
Normally, one control data point is plotted for each batch of 20 samples (unless
otherwise specified). However, the following data are excluded from X M
computation:
1. Data having sample ID No. "0" (zero)
2. Auto calibration data and data for X or L-J control
3. Data assumed to be a blank or auto rinse
4. Data which exceeds the instrument linearity range, or unreliable data
5. Data reported with analysis error
6. Data containing a parameter displayed as "****" or "----" because of abnormal cell
size distribution
7. Data generated for a PDA test
NOTE: Parameters for QC having the limit#(%) of 0 (zero) do not appear on
the QC Charts. However, data in item 6. above, having patient mark
limit#(%) value set at 0 (zero) will be included in X
M computation.