RESULT INTERPRETATION/REPORTS, Stored Data, List Display
4-16 Sysmex SF-3000 Operator's Manual -- Revised September 1995
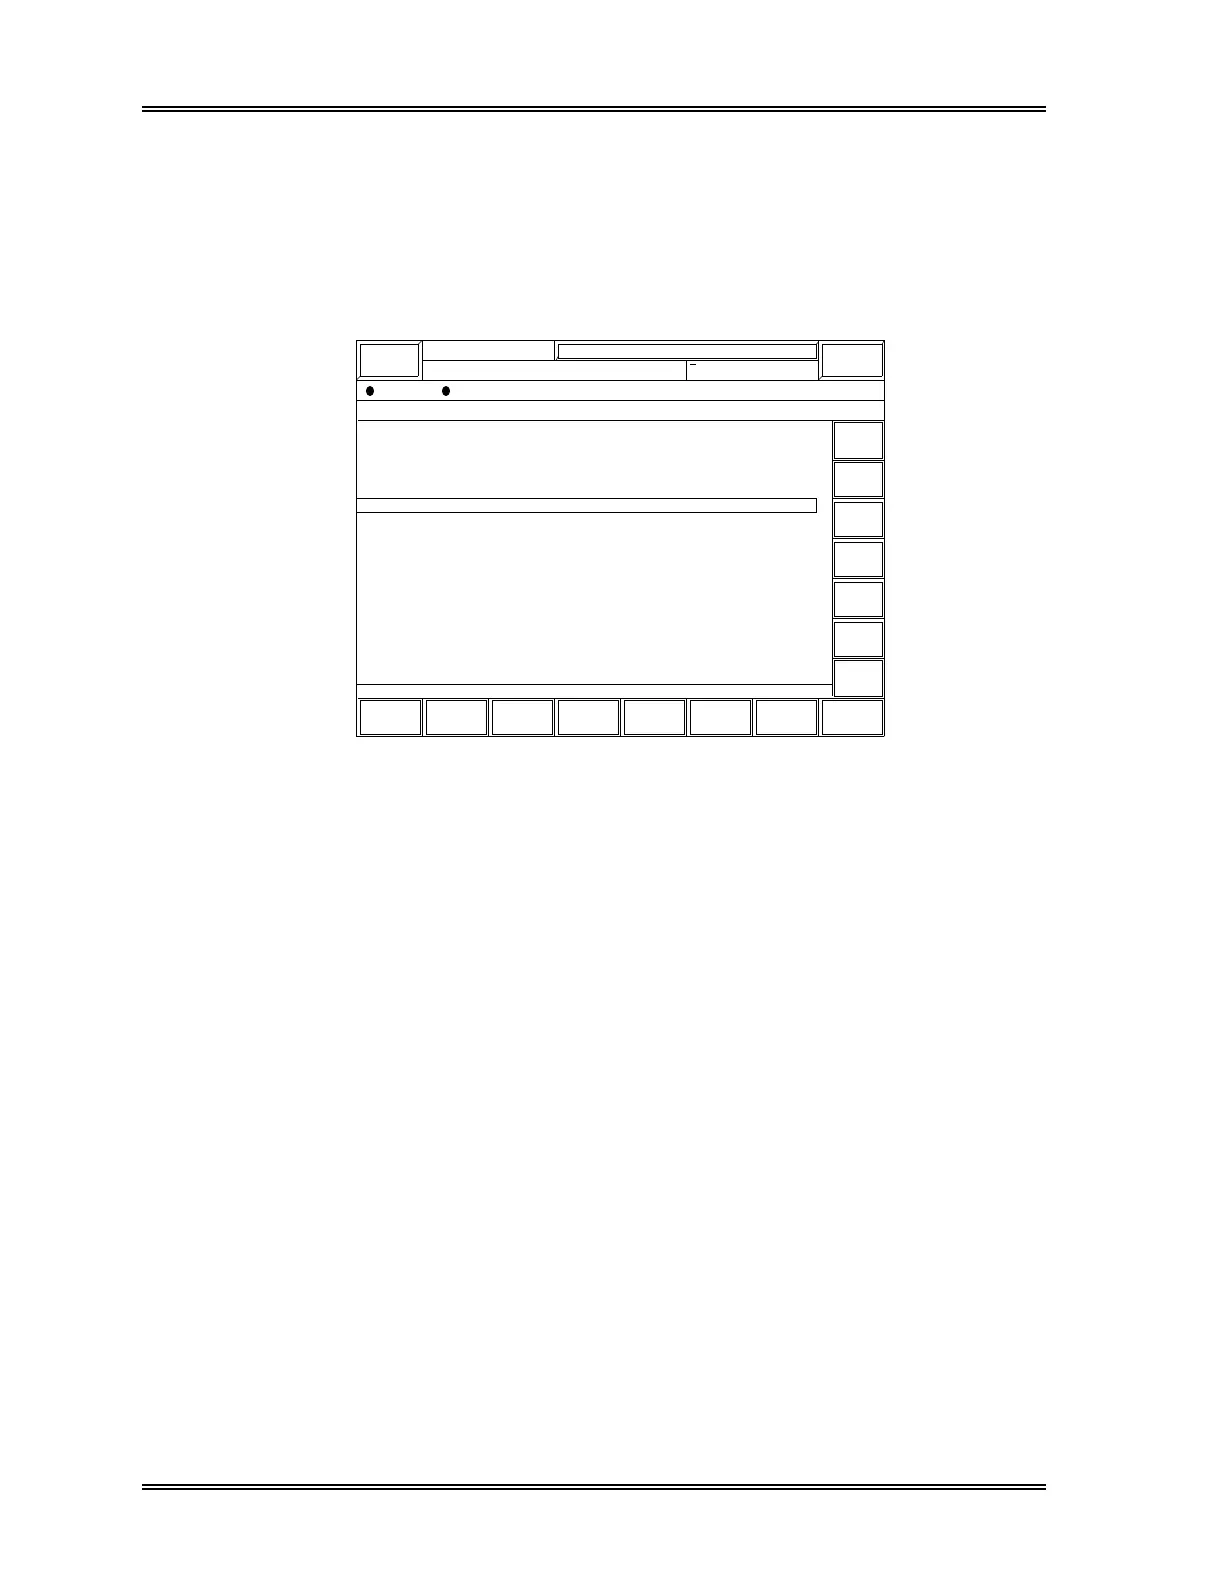
3.5 RBC/PLT Screen (Page 5)
This screen lists the following RBC and PLT analysis data: MCV, RDW-SD, RDW-CV,
PDW, MPV and P-LCR.
To switch to this screen from "P4. WBC+5Diff%", press [→] key. To switch to this
screen from "P6. IP Messages", press [←] key.
SAMPLE NO. DISTR MCV RDW-SD RDW-CV PDW MPV P-LCR
Sysmex
DP:1234567890123 XM HC GP DP SU
Ready Manual Mode Next No.1234567890123
Sampler
900/1000(1000)
= ALL SAMPLES = Stored Data
123-56789-101*
123-56789-101*
123-56789-102
123-56789-103
ERR0000000001
ERR0000000002
123-56789-106
123-56789-107
123-56789-108
ERR0000000003
123-56789-110
123-56789-111
123-56789-112
123-56789-113
123-56789-114
123-56789-115
ERR0000000004
ERR0000000005
ERR0000000006
ERR0000000007
89.2
96.5
90.5
88.6
91.9
99.2
111.7
93.9
93.4
92.5
96.8
85.9
114.2
101.0
95.0
95.9
95.1
95.4
96.9
94.9
56.1
46.9
41.6
56.8
46.9
45.0
59.0
41.7
49.8
53.8
42.8
41.0
74.3
52.5
53.0
58.4
47.4
48.6
43.3
49.1
18.4
14.0
13.4
12.4
14.8
13.1
15.0
12.8
15.6
16.6
12.8
13.5
18.5
14.8
16.9
17.2
14.3
14.9
13.0
14.9
16.3
13.2
12.1
12.6
12.2
13.8
16.3
14.2
9.3
8.9
10.4
13.0
13.0
12.4
10.8
11.6
10.3
13.6
16.5
13.7
12.6
10.8
10.7
10.5
10.3
11.7
10.0
11.5
8.7
8.6
9.3
10.7
11.1
10.8
10.1
10.3
9.8
10.8
12.8
10.8
44.7
32.0
29.3
24.5
28.2
38.2
28.2
37.4
14.4
13.7
18.5
30.1
32.6
31.0
24.2
26.2
19.5
33.5
45.8
33.0
R
W
R
R
WRP
P
W
P
W
W
P
R
Search
Select
Display
Output
SortGraphic Valid.
More Return
Next
Prev
Mark
→
←
↑
↓
v
v
v
v
v
v
v
v
v
v
v
v
v
v
v
v
v
v
v
v
Figure 4-6: RBC/PLT Screen (P5)
1) "v" (validated) Mark
Indicates that this data is validated. Refer to Section 5: Data Validation in this
chapter.
2) SAMPLE NO.
Sample No., as read by bar code reader or input by the operator.
3) DISTR
Indicates that the sample has abnormal particle size distribution or scattergram.
W (backlit in yellow) : abnormal WBC scattergram
R (backlit in yellow) : abnormal RBC particle size distribution
P (backlit in yellow) : abnormal PLT particle size distribution