RESULT INTERPRETATION/REPORTS, Stored Data, List Display
4-14 Sysmex SF-3000 Operator's Manual -- Revised September 1995
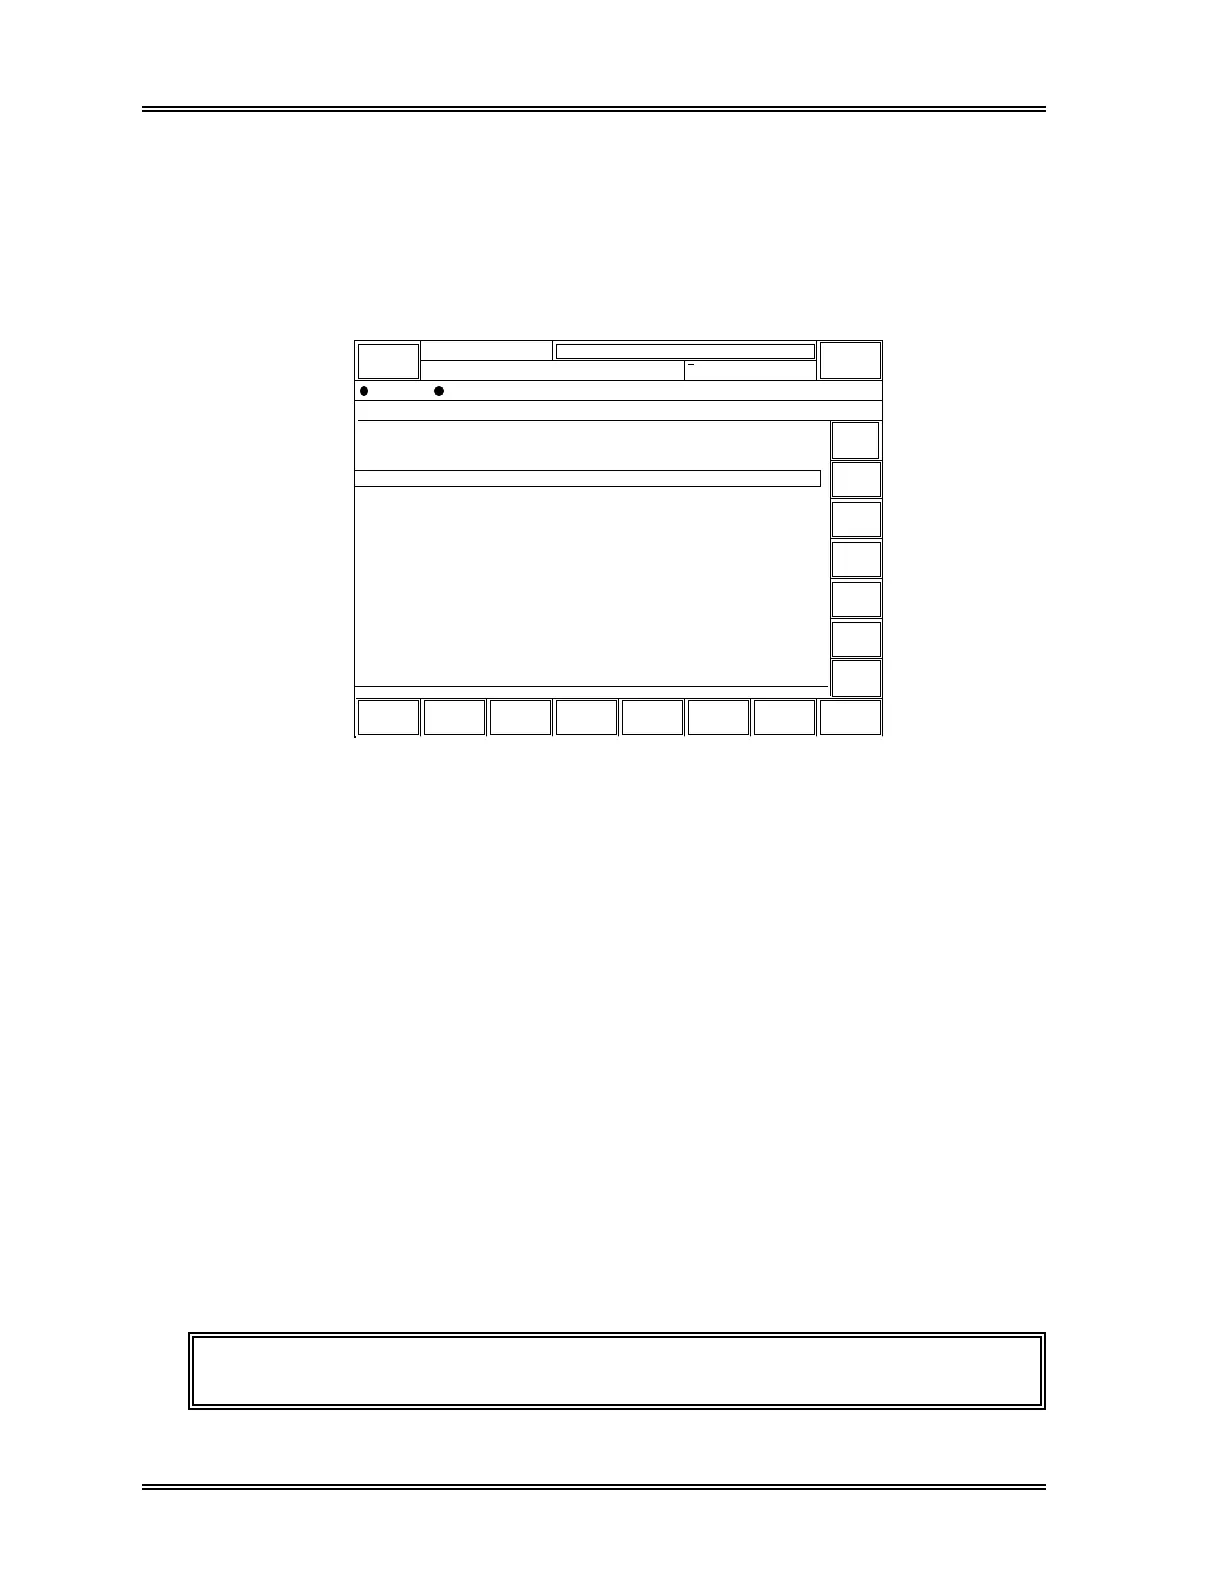
3.3 WBC+5Diff# Screen (Page 3)
This screen lists the WBC count and the absolute values for the following 5DIFF
parameters: NEUT#, LYMPH#, MONO#, EO# and BASO#.
To switch to this screen from "P2. CBC8", press [→] key. To switch to this screen
from "P4. WBC+5Diff%", press [←] key.
Search
Select
Display
OutputSortGraphic Valid.
More Return
Sysmex
DP:1234567890123
XM HC GP DP SU
Ready
Manual Mode Next No.1234567890123
Sampler
Next
Prev
Mark
Stored Data
900/1000(1000)
= ALL SAMPLES =
→
←
↑
↓
SAMPLE NO. WBC NEUT# LYMPH# MONO# EO# BASO#
123-56789-101*
123-56789-101*
123-56789-102
123-56789-103
123-56789-104
123-56789-105
123-56789-106
123-56789-107
123-56789-108
123-56789-109
123-56789-110
123-56789-111
123-56789-112
123-56789-113
123-56789-114
123-56789-115
123-56789-116
123-56789-117
123-56789-118
123-56789-119
5.38
7.68
4.82
5.90
1.41
4.68
1.06
11.79
5.20
6.60
6.21
6.73
8.44
4.37
23.31
6.38
5.26
6.26
4.94
6.04
3.90
3.65
3.99
4.12
2.78
4.47
2.59
3.91
3.66
2.94
4.29
420
1.74
3.94
5.22
2.82
3.64
4.72
3.51
4.68
34.8
35.3
36.1
36.5
25.6
44.3
28.9
36.7
34.1
27.2
41.5
36.1
19.9
39.8
49.6
27.0
34.6
45.0
34.0
44.4
29.8
33.2
30.1
28.2
31.8
32.4
39.7
33.1
31.4
29.4
32.5
29.8
40.4
34.5
30.9
32.0
32.0
30.7
35.1
31.1
33.4
34.4
33.2
31.8
34.6
32.7
35.5
35.3
33.6
31.8
33.6
34.7
35.4
34.2
32.6
33.4
33.6
32.2
36.2
32.7
3.23
2.23
2.71
1.72
1.63
3.48
0.31
2.42
4.45
2.81
4.98
2.97
0.54
1.90
3.89
3.08
4.76
0.00
0.00
0.00
v
v
v
v
v
v
v
v
v
v
v
v
v
v
v
v
v
v
v
v
Figure 4-4: WBC+5Diff# Screen (P3)
1) "v" (validated) Mark
Indicates that this data is validated. Refer to Section 5: Data Validation in this
chapter.
2) SAMPLE NO.
Sample No., as read by bar code reader or input by the operator.
3) Indications
The following indications appear to the right of analysis data:
① ! (backlit in red):
Indicates that the data is outside the Critical Limits.
➁ * (backlit in red):
Indicates that the data is outside the Linearity Limits.
➂ +, – (backlit in red):
Indicates that the data is outside the Sampler Stop Limits.
➃ * (backlit in yellow):
Indicates that the data is unreliable because of an abnormality detected in the
sample.
⑤ +, – (backlit in yellow):
Indicates that the data is outside the Mark Limits.
NOTE: The above indications are listed on the priority basis.