QUALITY CONTROL, QC Chart
6-36 Sysmex SF-3000 Operator's Manual -- Revised September 1995
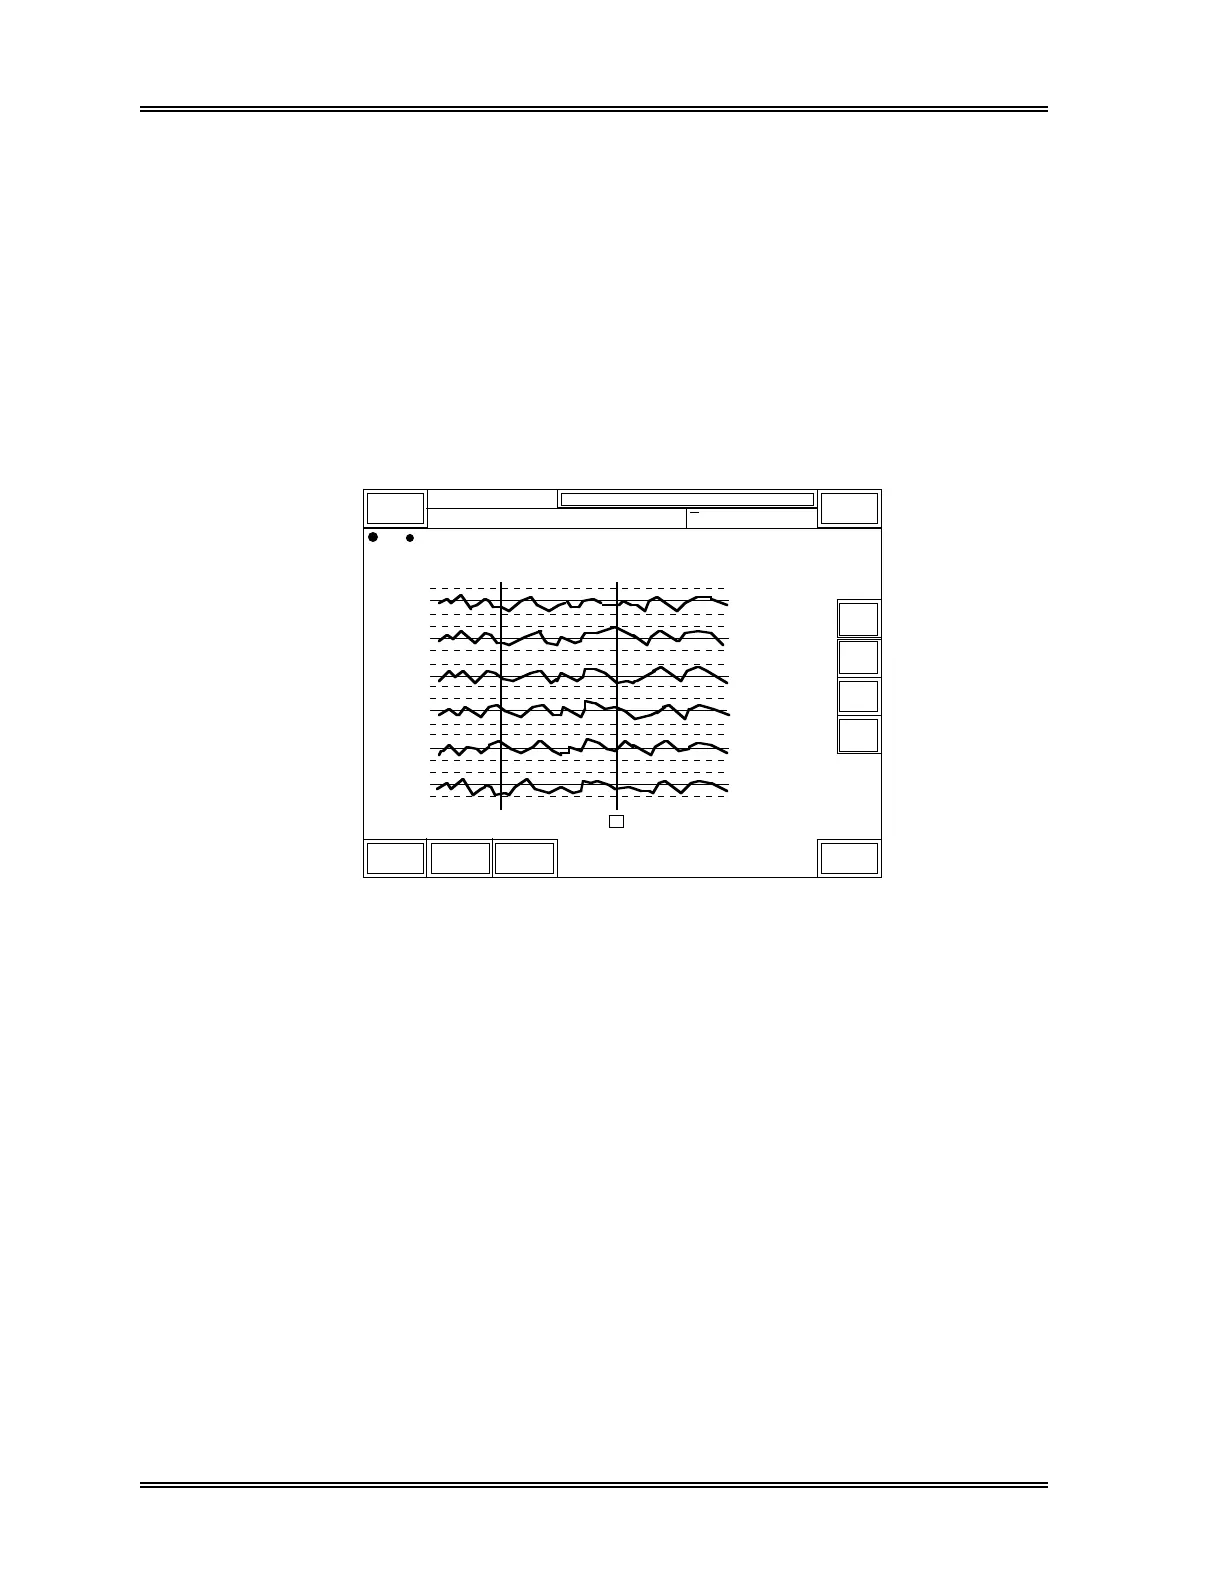
7.3 Mean/SD (Calculation)
This program automatically computes the mean, standard deviation (SD) and coefficient
of variation (CV) for the data specified using the two vertical-line cursors on the QC
chart, and displays them at the far right of the screen.
(1) Press [QC] to display the QC second menu.
(2) Press [Mean/SD] keypad from the second menu.
Two vertical-line cursors (A and B) appear on the screen. The cursors are moved
to specify the data range for Mean/SD computation. Initially, the selected cursor is
cursor B, and is backlit in green. To switch selected cursors, press the [Cursor]
key in the menu line.
UL
LL
UL
LL
UL
LL
UL
LL
UL
LL
UL
LL
Mean5/18
N=50
SD
Return
DP:1234567890123
Sysmex
XM HC GP DP SU
Ready
Manual Mode Next No.1234567890123
Sampler
Q C
RBC
HGB
HCT
MCV
MCH
MCHC
3.85
14.11
38.54
89.42
28.57
29.33
AB
Cursor Exclude Select
5/10
0.31
1.23
2.54
7.86
2.72
3.03
(CV)%
( 8.01)
(10.00)
( 6.65)
( 8.91)
( 9.41)
(10.65)
< Mean/SD >
↑
↓
→
←
QC01 LOT No. 12345678
Figure 6-33: Computation Range Selection Screen
(3) Use the [↑] and [↓] keys to switch screens.
(4) Check the control data.
If there is unsuitable data for target and limit value computations, sandwich the data
between the 2 cursors by using the [←] and [→] keys. Then, press [Exclude]
keypad. The exclusion confirmation message will appear.