CALIBRATION
7-14 Sysmex SF-3000 Operator's Manual --- Revised September 1995
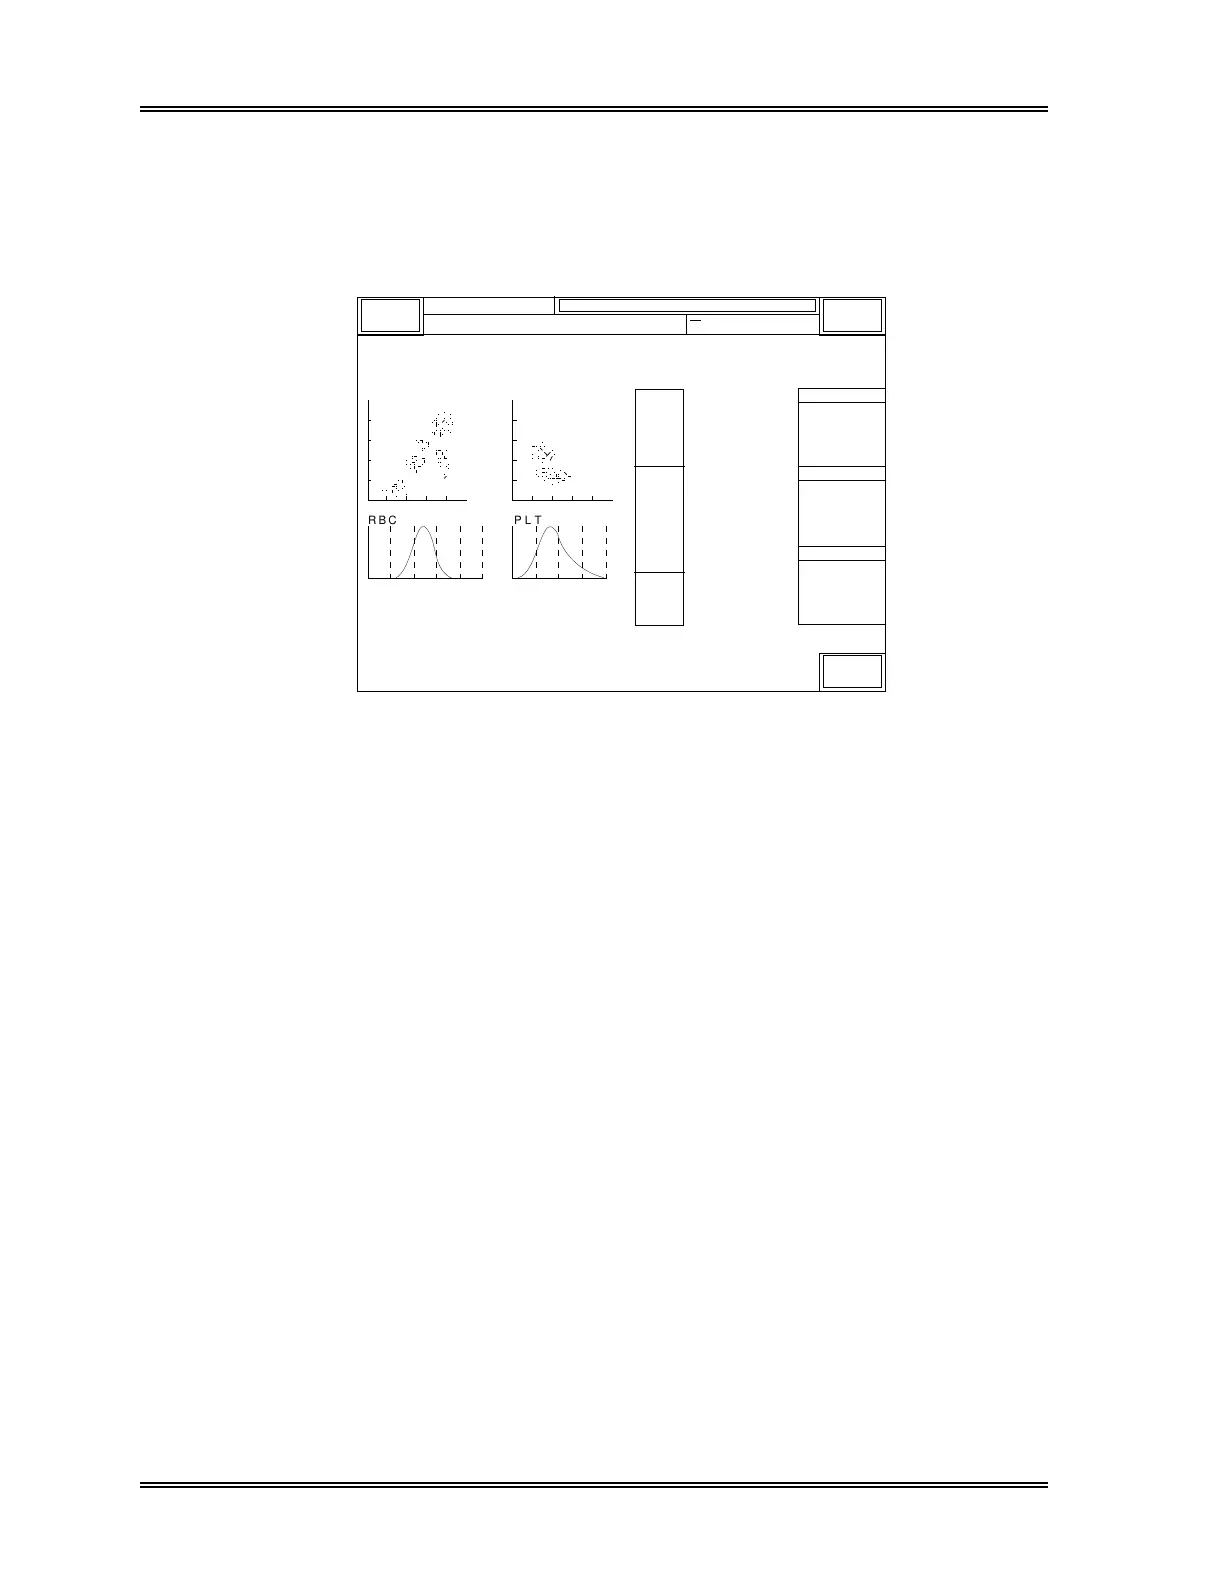
2.6 Graphic (Displaying Graphs)
(1) From the HGB/HCT Auto submenu, press [Graphic]. The scattergrams and
particle size distributions of the last sample analyzed will be displayed.
XM
SAMPLE No. 1NO.
R B C P L T
D I F F W B C / B A S O
[g/dL]
[fL]
WBC
NEUT
LYMPH
MONO
EO
BASO
RBC
HGB
HCT
MCV
MCH
MCHC
RDW-SD
RDW-CV
PLT
PDW
MPV
P-LCR
250fL 40fL
RBC Flag
PLT Flag
WBC Flag
DP:1234567890123
Sysmex
Ready
Sampler
3
[x10 /uL]
[%]
[%]
[%]
[%]
[%]
6
[x10 /uL]
[g/dL]
[%]
[%]
[%]
[fL]
[fL]
[fL]
3
[x10 /uL]
[pg]
Manual Mode
Next No.1234567890123
HC GP DP SU
7.23
4.62
1.55
0.71
0.18
0.17
4.74
14.1
41.6
87.8
29.7
33.9
46.4
15.7
213
9.8
10.3
24.3
63.9
21.4
9.8
2.5
2.4
R:0000-00 15:48 1996/6/30
Return
Figure 7-15: Graphic Display Screen
(2) Press [Return] key and the instrument returns to the HGB/HCT Auto screen,
permitting Auto Cal. to continue.