QUALITY CONTROL
Sysmex SF-3000 Operator's Manual -- Revised September 1995 6-31
7. QC CHART
When the QC program is executed by pressing the [QC] keypad in the root menu, a QC
Chart will be displayed as the QC main screen. Using this QC Chart, QC data output,
Statistical calculations and control data point deletion can be performed.
(1) Press [QC] to display the QC second menu. The first page of the QC Chart (P1.
RBC) will be displayed.
The QC chart title displayed is < X Chart > when X Control is the selected QC
NOTE: When the X Control is selected in the System Settings program, the
QC chart title is < X
Chart > even if L-J Control is performed, or vice-
versa. Select the correct control method. Refer to
Section 3: System
Settings
in this chapter.
4.36
3.96
3.56
13.9
12.6
11.3
42.6
38.7
34.8
96.0
87.2
78.4
31.6
28.7
25.8
UL
LL
UL
LL
UL
LL
UL
LL
UL
LL
UL
LL
Limit
5/18
5/18 9:20
Data
+
31.8
28.9
26.0
XM Start
/Stop
ReturnOutput MoreFile Mean/SD
Target
Limit
Delete
DP:1234567890123
Sysmex
XM HC GP DP SU
Ready
Manual Mode Next No.1234567890123
Sampler
Q C
Q C01 LOT No. 12345678
< L-J Chart >
RBC
HGB
HCT
MCV
MCH
MCHC
3.85
14.1
38.5
89.4
28.5
29.3
↑
↓
→
←
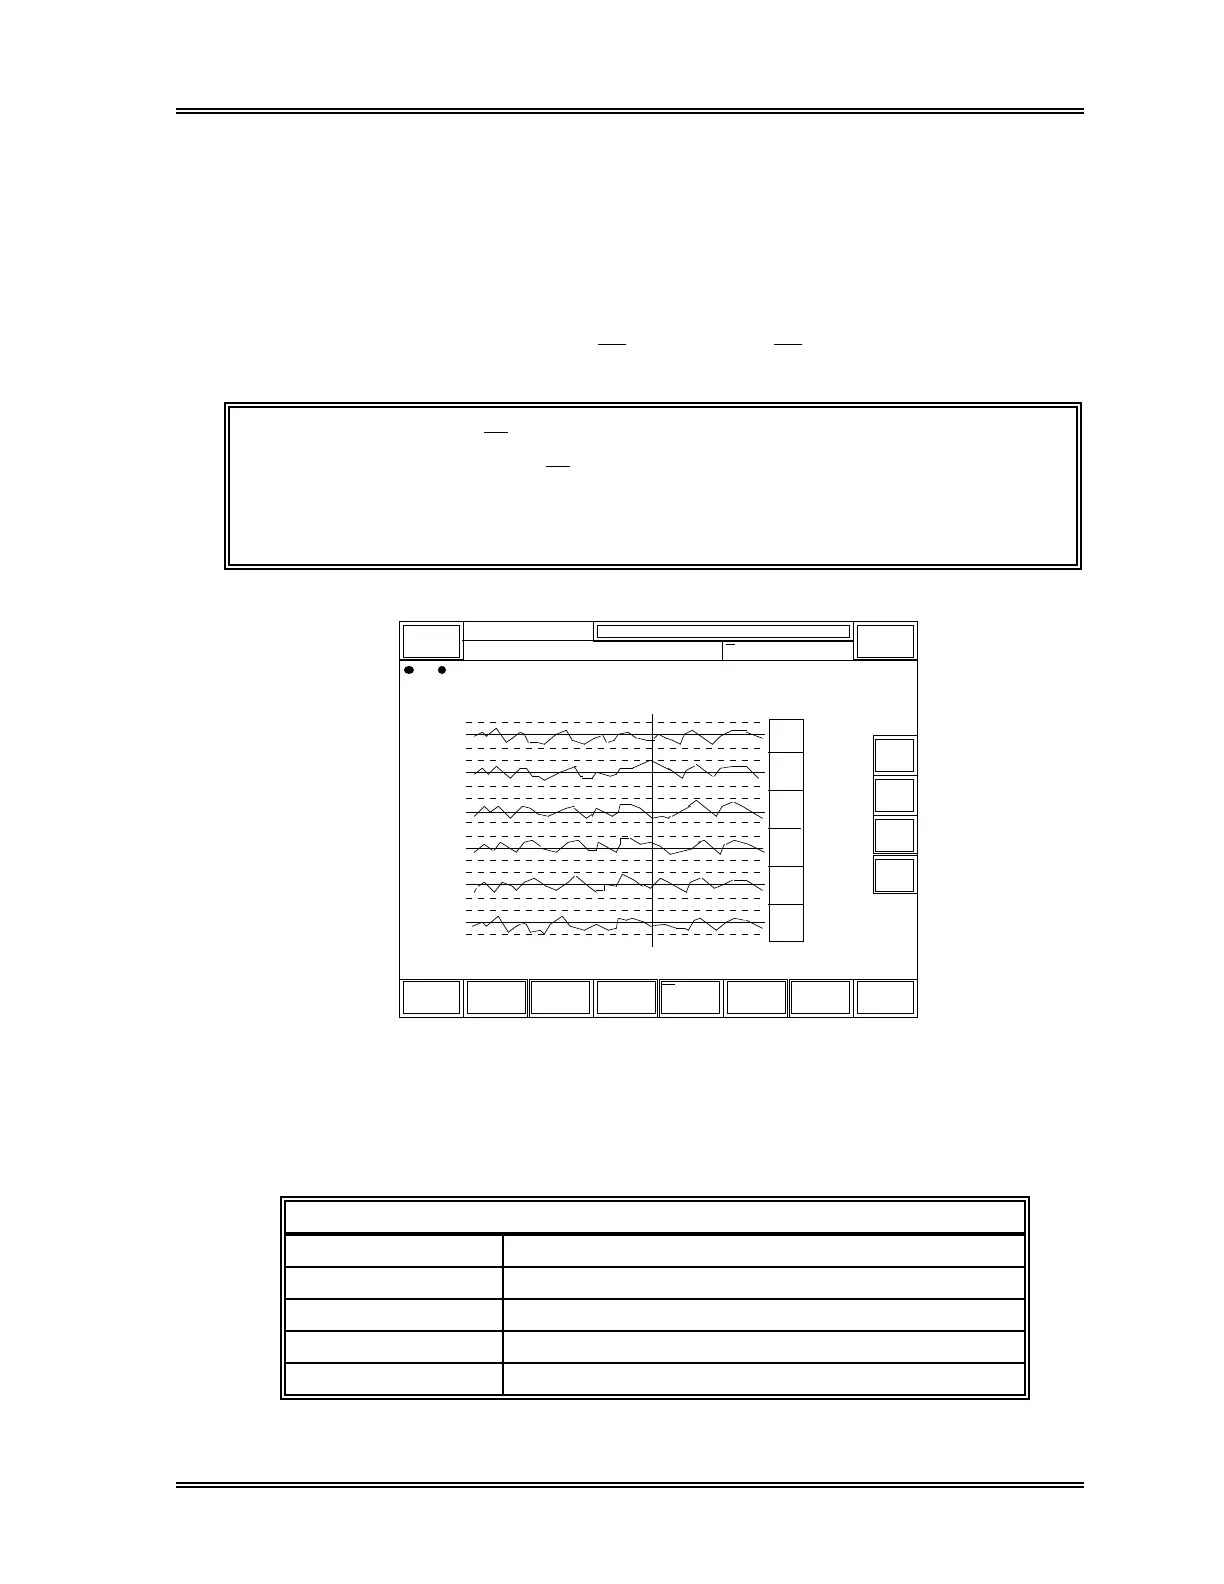
Figure 6-29: QC Chart Screen - P1. RBC
(2) Use the [↑] and [↓] keys to switch pages. The pages are switched in the following
order:
QC Chart Display Items
P1. RBC RBC, HGB, HCT, MCV, MCH, MCHC
P2. PLT+5Calc. RDW-SD, RDW-CV, PLT, PDW, MPV, P-LCR
P3. WBC+5DIFF# WBC, NEUT#, LYMPH#, MONO#, EO#, BASO#
P4. 5DIFF% NEUT%, LYMPH%, MONO%, EO%, BASO%
P5. DIFF Sensitivity GRAN-X, GRAN-Y, WBC/BA-X, WBC/BA-Y, GRAN-Y (W)