FUNCTIONAL DESCRIPTIONS
Sysmex SF-3000 Operator's Manual -- Revised September 1995 10-15
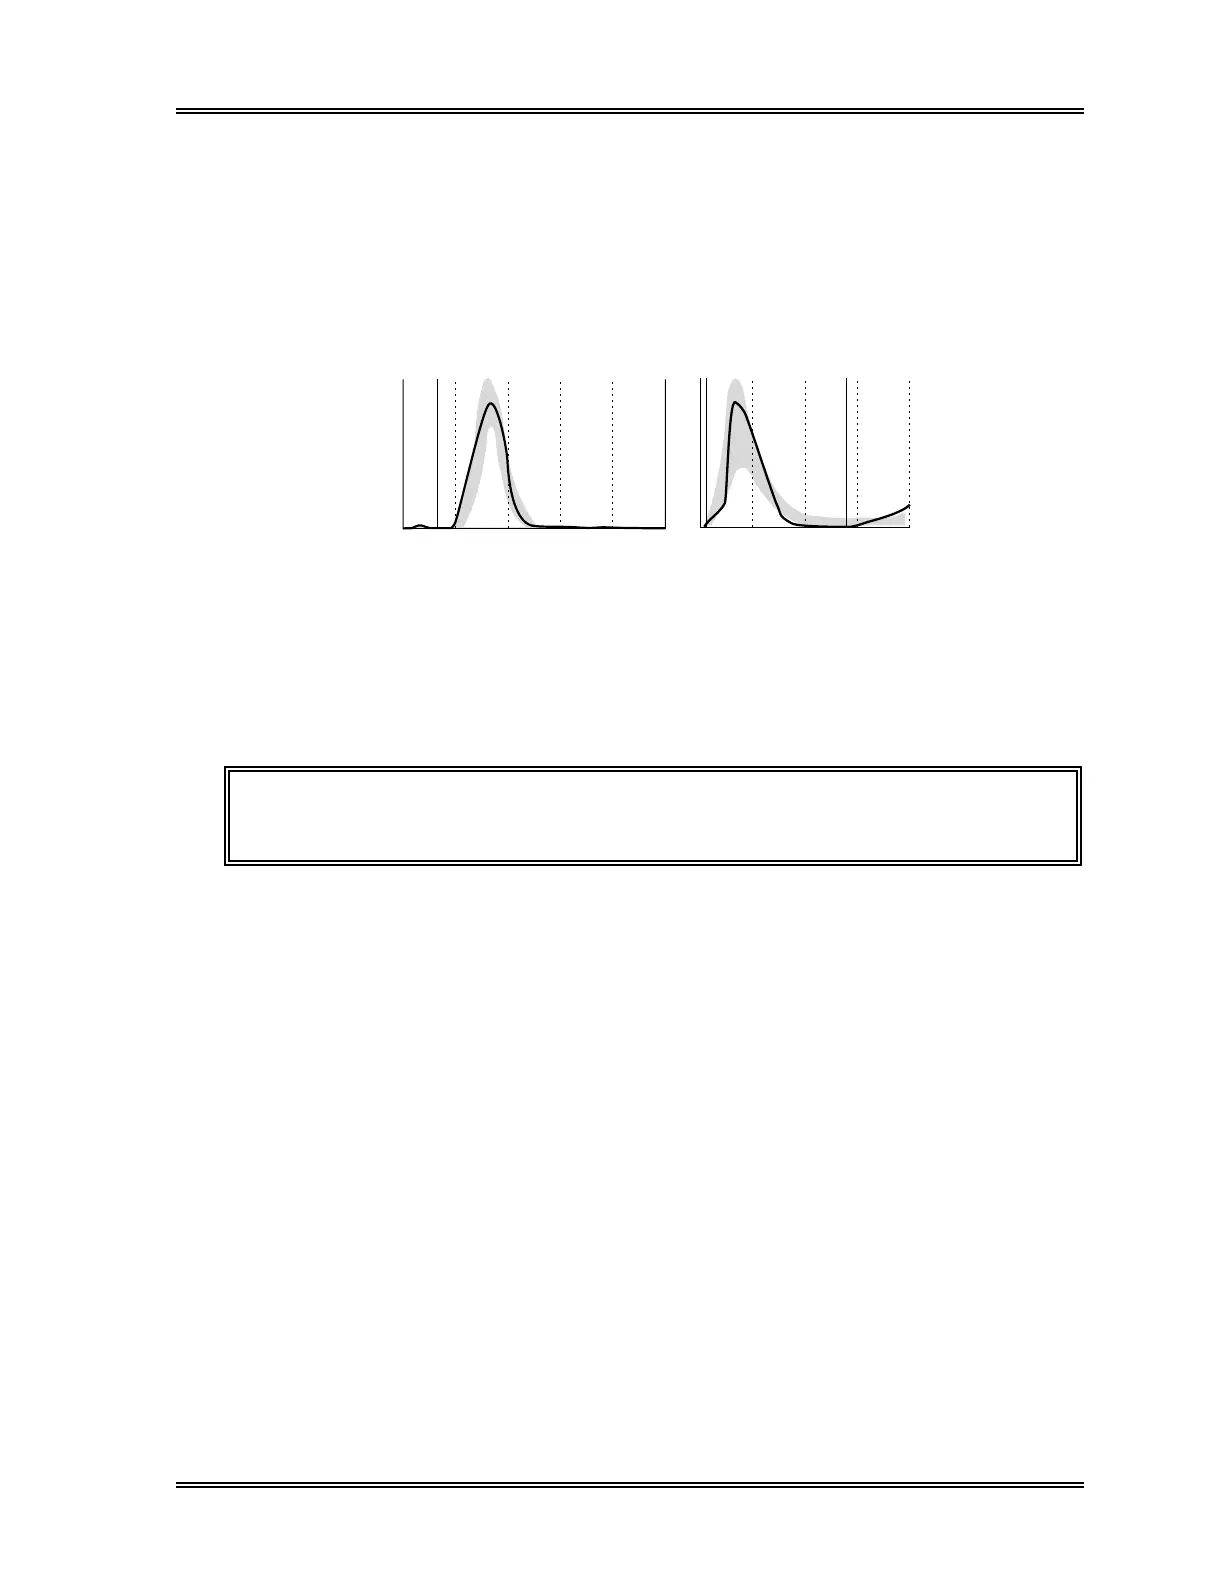
Features: • High/lower cell counts can be quickly visualized from the
histogram.
• Abnormal histogram patterns can be quickly recognized when
histograms differ from normograms.
Applicable Display: RBC histogram and PLT histogram when the Normal Range is
set to be displayed. See Chapter 11 for procedures.
RBC
250fL
PLT
40fL
Figure 10-16: Normogram Representation Method
7.4 Histogram Flags
If the histogram is abnormal, one or more of the following error flags will appear.
NOTE: Histogram error flags are seen in the RBC/PLT system of the service
data screen only. See
Chapter 8, Section 3.14: Service Data.
RBC Histogram
LD: The relative height at the RBC lower discriminator exceeds the preset limit.
UD: The relative height at the RBC upper discriminator exceeds the preset limit.
DW: The RBC histogram does not cross the 20% height level twice, and the RDW-SD
data is "---.-".
MP: Two or more RBC populations exist, and the RDW-SD data is "---.-".
PLT Histogram
LD: The relative height at the PLT lower discriminator exceeds the preset limit.
UD: The relative height at the PLT upper discriminator exceeds the preset limit.
DW: The PLT histogram does not cross the 20% height level twice, and the PDW data
is "---.-".
MP: Two or more PLT populations exist, and the PDW data is "---.-".