QUALITY CONTROL, QC Chart
6-34 Sysmex SF-3000 Operator's Manual -- Revised September 1995
7.2 Output QC Chart/Data
In this program, the QC Chart range specified is printed by a Graphic Printer. Also, use
this program to output the QC data of the specified range on a QC Chart to a Graphic
Printer, a Line Printer and/or a Host Computer.
(1) Press [QC] to display QC second menu.
(2) Press [Output] keypad from the second menu.
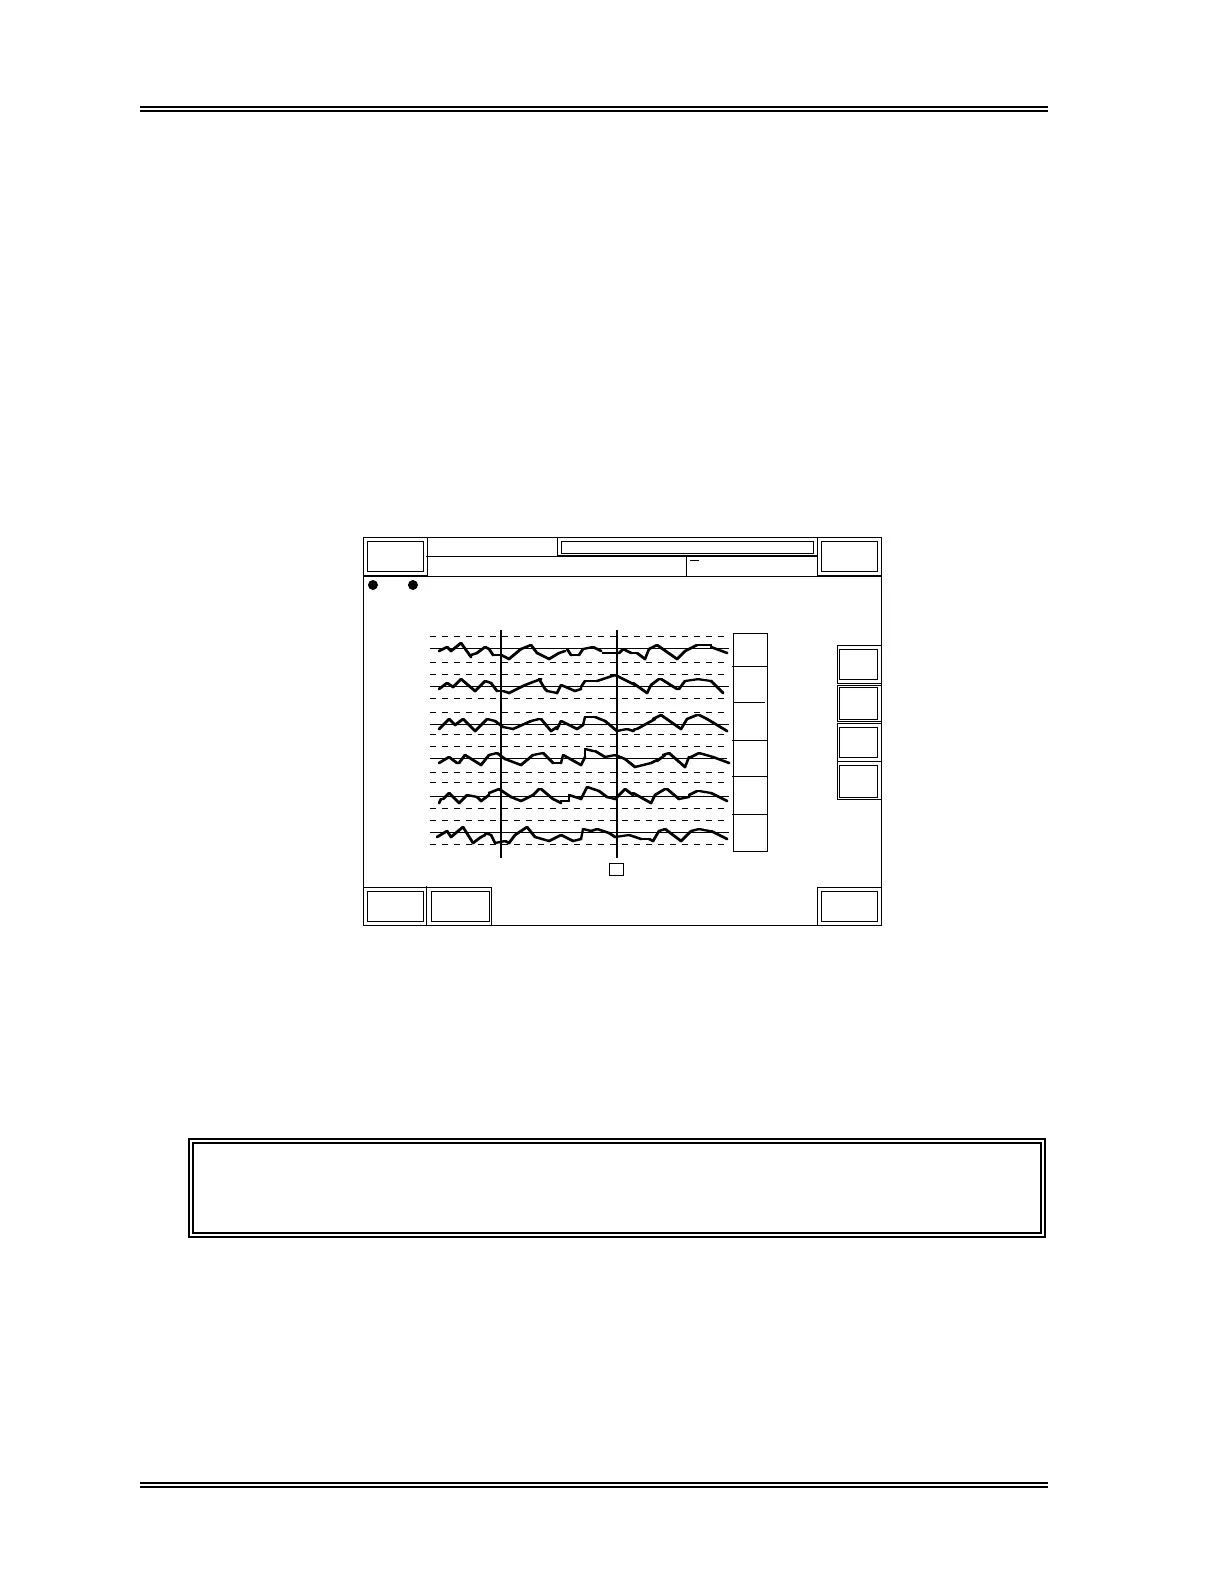
Two vertical-line cursors (A and B) appear on the screen. The cursors are moved
to specify an output data range. Initially, the selected cursor is cursor B, and is
backlit in green. To switch selected cursors, press the [Cursor] key in the menu
line.
The data on which the selected cursor is positioned are displayed in the Data
column.
4.36
3.96
3.56
13.9
12.6
11.3
42.6
38.7
34.8
96.0
87.2
78.4
31.6
28.7
25.8
UL
LL
UL
LL
UL
LL
UL
LL
UL
LL
UL
LL
Limit
5/18
5/18 9:20
Data
+
31.8
28.9
26.0
DP:1234567890123
Sysmex
XM HC GP DP SU
Ready
Manual Mode Next No.1234567890123
Sampler
Q C < Output >
RBC
HGB
HCT
MCV
MCH
MCHC
3.85
14.1
38.5
89.4
28.5
29.3
AB
↑
↓
→
←
ReturnSelectCursor
QC01 LOT No. 12345678
Figure 6-31: Output Range Setting Screen
(3) Use the [↑] and [↓] keys to switch screens.
Using the [←] and [→] keys, move the cursor to specify the range of data to be
output.
NOTE: The data on which the cursors are positioned is included in the range
specified.