FUNCTIONAL DESCRIPTIONS
10-14 Sysmex SF-3000 Operator's Manual -- Revised September 1995
7.3 Particle Size Distribution Representation
The shape of a particle size distribution (histogram) changes according to the method of
representation. The distribution width of the particle size distribution, in particular, can
appear completely different, depending on how it is presented or drawn.
The SF-3000 employs two representation methods: a Relative Height Method (Normal
Expression); and an Absolute Count with Normogram Representation (Dotted Normal
Range), developed to permit the user to obtain more information directly from the particle
size distribution.
1 . Relative Height Representation Method
This representation method normalizes the particle size distribution, drawing the peak to
full scale (maximum height when the histogram is displayed).
Features: • Distributions of different counts can be viewed with the same
scale.
• Distribution widths can be visually compared.
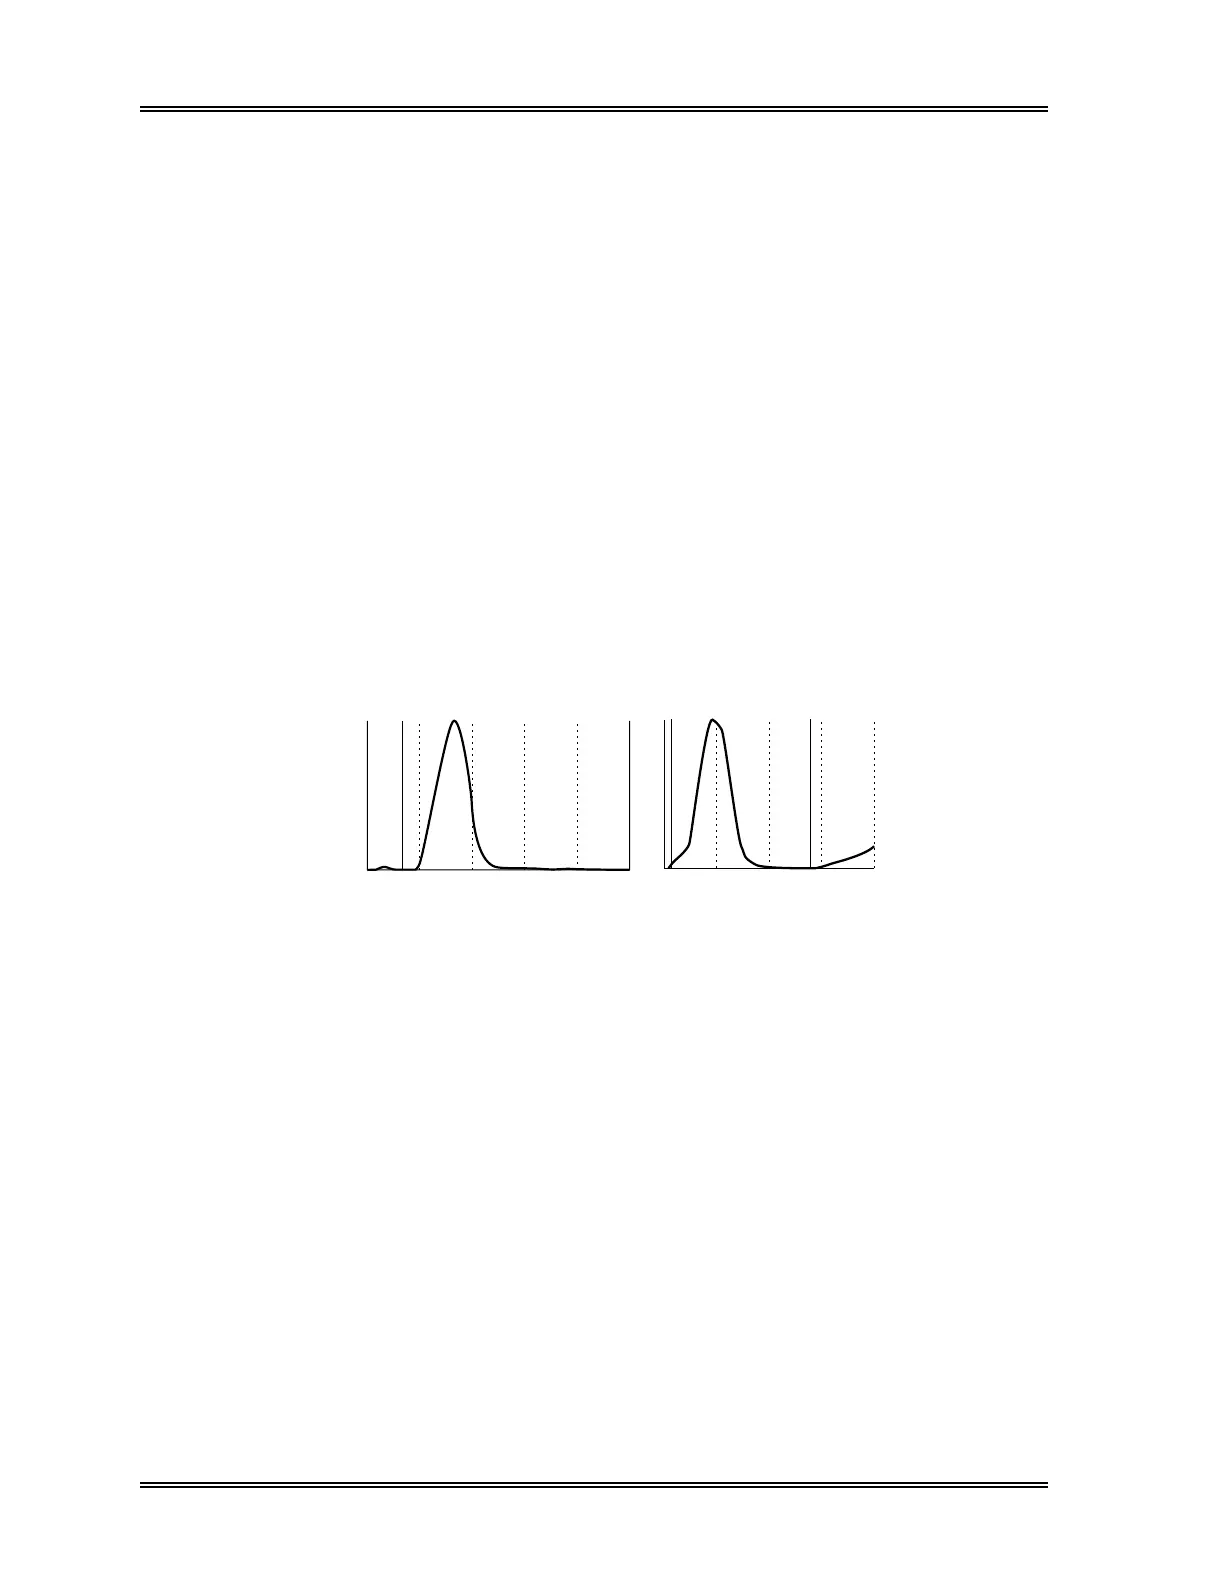
Applicable Display: RBC histogram and PLT histogram
RBC
250fL
PLT
40fL
Figure 10-15: Relative Height Representation Method
2 . Normogram Representation Method
This representation method expresses the peak of the histogram in relation to an empirical
normogram (dotted normal range - normal particle size range). If the histogram is within
or below the normogram, the normogram is displayed at full scale (100%). However, if
the histogram peak is greater than the normogram, the histogram peak is displayed at
100%. In this case, the normogram becomes lower in proportion to the histogram peak.
The normogram uses a 10 to 90 percentile range obtained by overlapping the histograms
of a large number of patients.