Chapter 3 Principle of Operation
60 Gem-5 User’s Manual
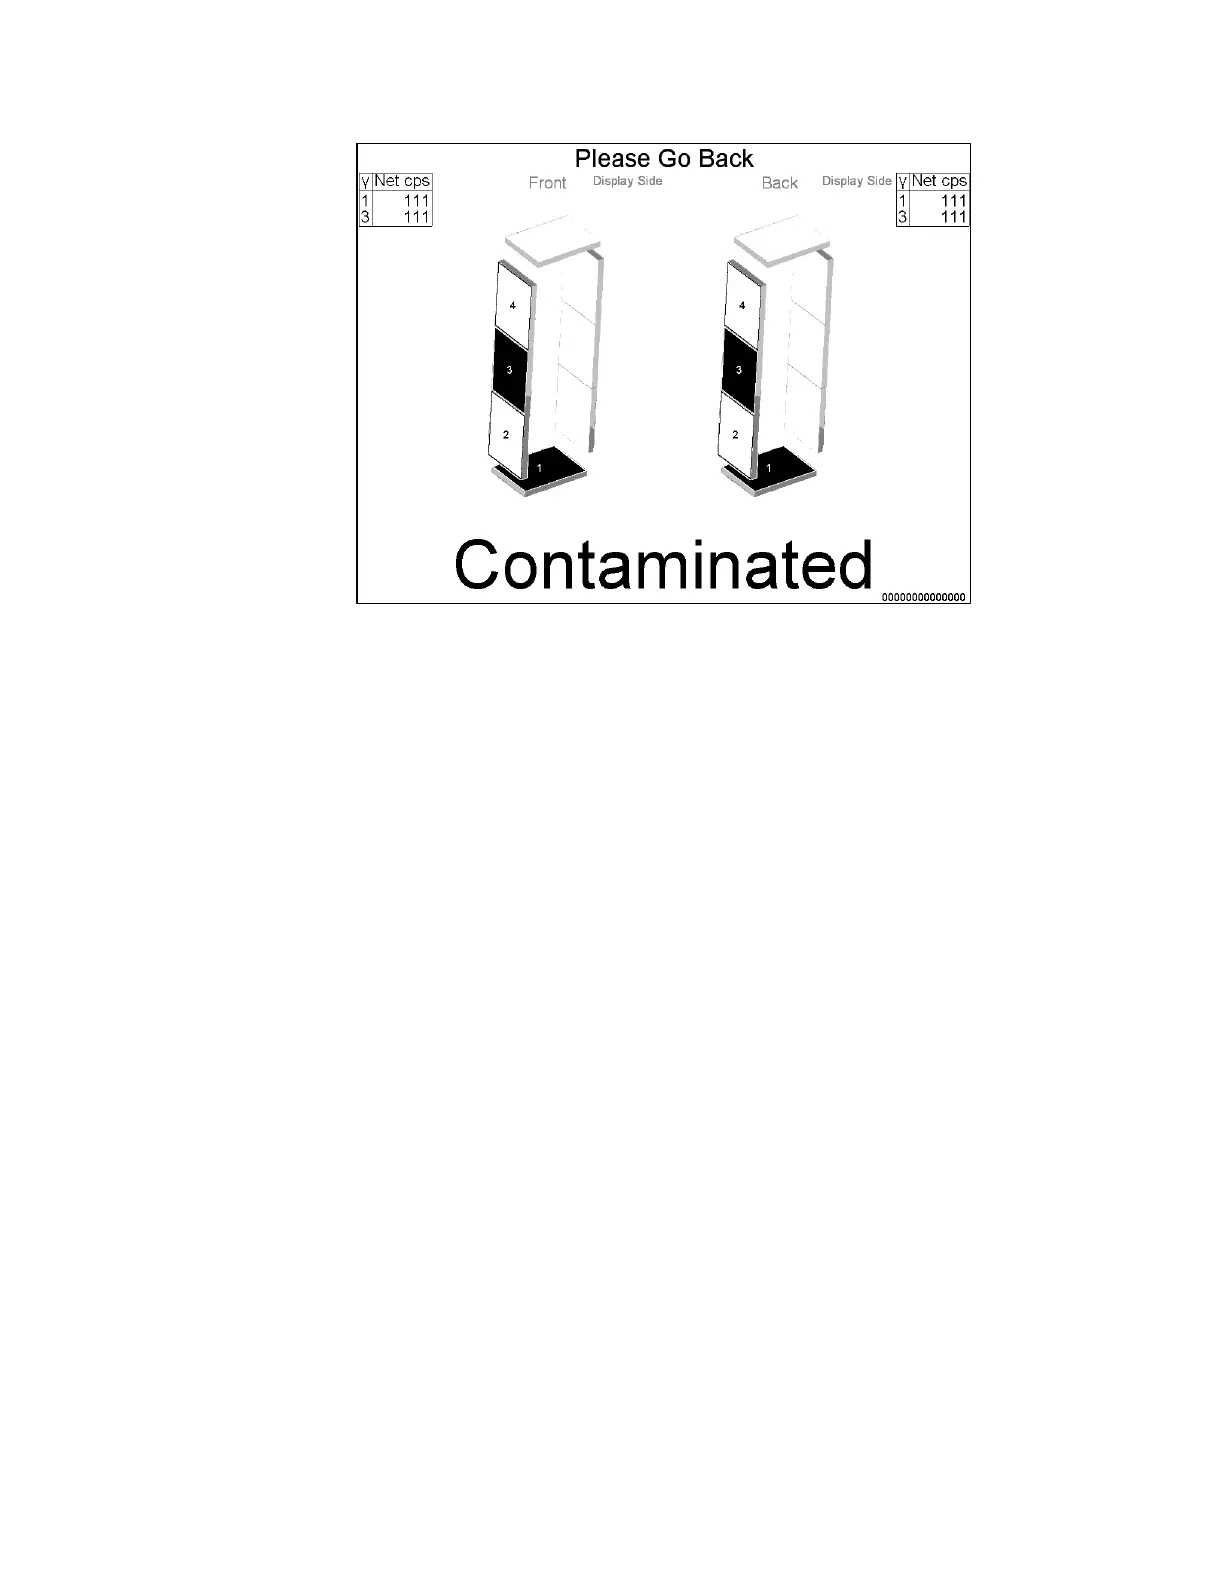
Figure 29 The Display Shows the Detector Zone (or detector(s)) Position and Activity
Values in Choice of Units for a Contaminated Result
A display of the detector array is also shown (see Figure 29 above) where detector(s)
showing contamination are seen as flashing red, whereas clean detectors are shown in
green. The Net count Rate(s), Gross count Rate(s), or net Activity (as setup in the
F5 – Configuration Setup screen) for all detectors showing contamination are shown
on the side of the display. Detectors with the highest count rates are listed first. A
contaminated result for a sum zone is assigned to the lowest number detector in the
zone. The screen displays the results for both positions – the left side of the screen
corresponds to Position 1 (for example, “face up against detector wall opposite the
display”) results and the right side corresponds to Position 2 (for example, “back to
detector wall facing the display”).
An empty variation (no red) can be displayed by the Display Last Contaminated
switch request if there are no previous RESULT…BMP or PNG files available. See
Ctrl+F10 – Factory Setup, F2 – Operation Configuration – Display Last
Contaminated setting.
• There exists a “Please Wait” variation. See Ctrl+F10 – Factory Setup, F2 –
Operation Configuration – Resume Contaminated setting. (Also shown when
Wait for Read Dosimeter is shown)
• For LDM61 the Contaminated Screen displays F3 – Setup, F11 –
Instructions, F5 – Contaminated – Wait for Read Dosimeter while dosimeter
is being read.