10 - 18 BeneVision N22/N19 Patient Monitor Operator’s Manual
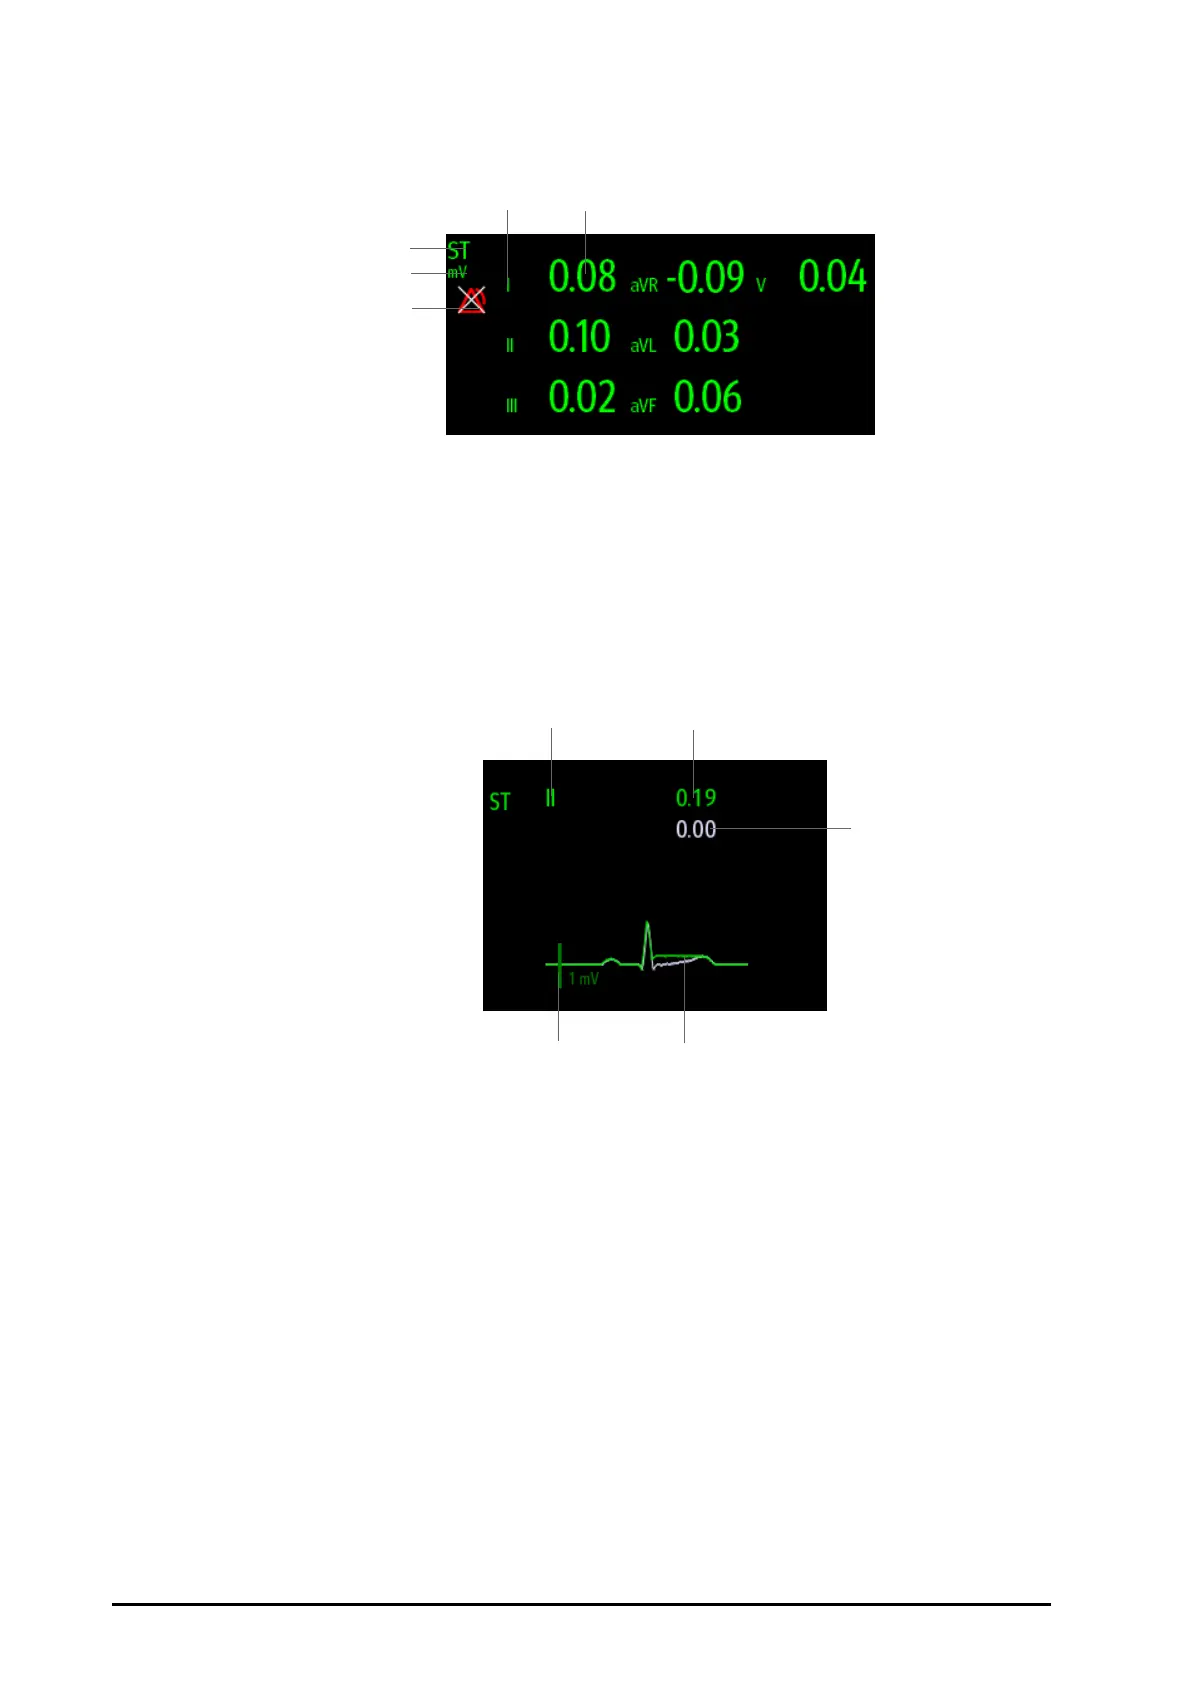
This example shows the ST numeric area when 5-lead ECG is used. Your monitor screen may look slightly
different:
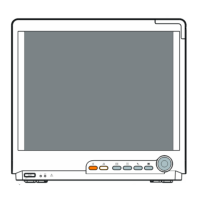
The waveform area displays the current and baseline ST segments. It also displays the current and baseline ST
values. In the following picture, the current ST segment and value is in green, the baseline ST segment and value
is in white.
10.7.4 Entering the ST View
The ST View shows a complete QRS segment for each ST lead. The color of current ST segments and ST values is
consistent with the color of ECG waveforms, normally green. The color of baseline ST segments and ST values is
white.
To enter the ST View, follow this procedure:
1. Select the ECG numeric area or waveform area to enter the ECG menu.
2. Select the ST tab.
3. From the bottom of the menu, select ST View.
(1) Parameter label (2) ST unit
(3) ST alarm off symbol (4) Lead labels
(5) ST numerics: a positive value indicates ST segment elevation, and a negative value indicates ST
segment depression.
(1) ST lead (2) The current ST value
(3) The baseline ST value (4) 1 mV scale
(5) The current ST segment (green) and baseline ST segment (white)