31 - 2 BeneVision N22/N19 Patient Monitor Operator’s Manual
31.1 Overview
Trends are patient data collected over time and displayed in graphic, tabular, or other forms to give you a picture
of how your patient's condition is developing. You can view the trend data in the review window, minitrends
window, or OxyCRG window.
31.2 Review Window
The review window contains tabs to display trend data in tabular, graphic, or other forms. Each tab displays a
review page. Each of these review pages is covered in more detail in the following sections.
31.2.1 Entering the Review Window
Choose one of the following methods to enter the review window:
■ Select the Review quick key.
■ Select the Main Menu quick key → from the Review column select one option.
31.2.2 Sample Review Page
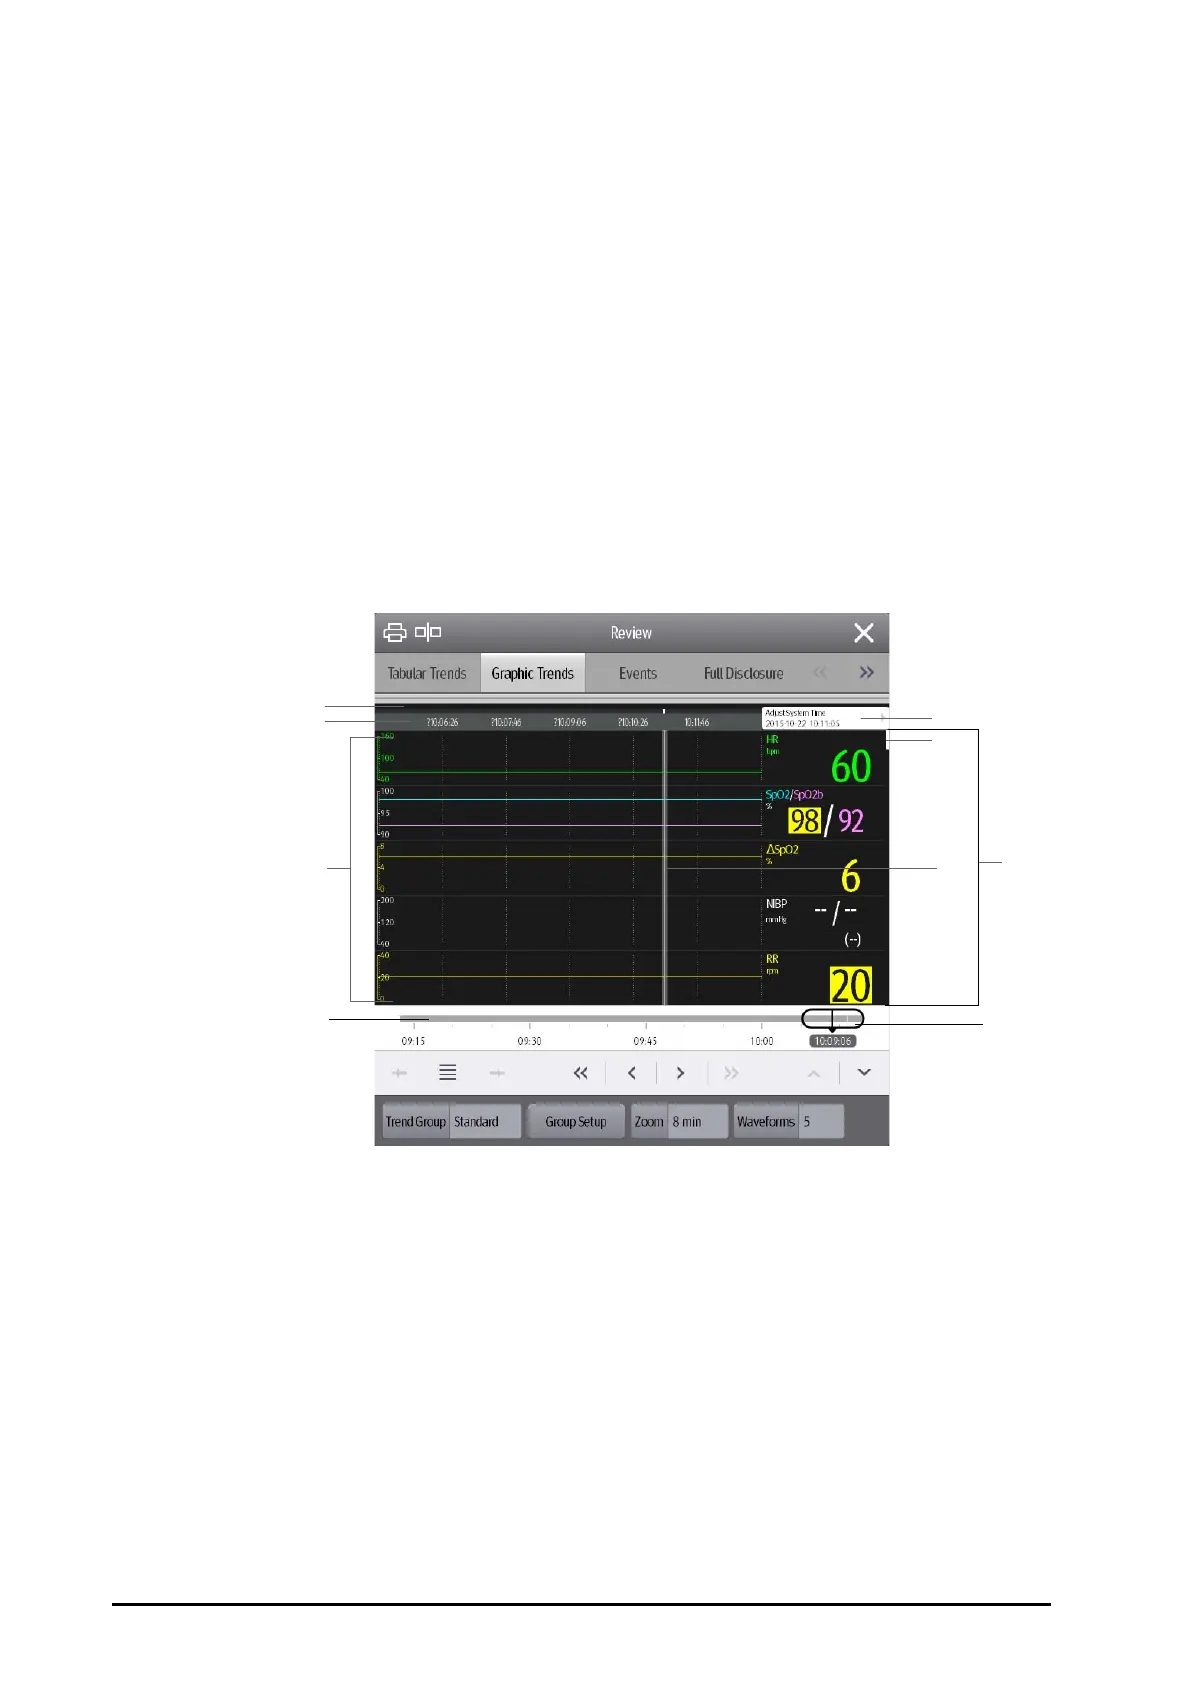
The review pages have a similar structure. We take the graphic trends review page as an example.
(1)
(2)
(7)
(3)
(9)
(5)
(4)
(6)
(8)
(1) Event type indicator: different color blocks match different types of events:
■ Red: high priority alarm event
■ Yellow: medium priority alarm event
■ Cyan: low priority alarm event
■ Green: manual event
■ White: operation-related event
(2) Current window timeline: indicates the time length of current window. In case of system time change, the
question mark “?” is displayed before the time.
(3) Event or message or current time area: after you select an event from the event list, this event is displayed in this
area. Selecting this area turns to the
Events review page. If an event is not selected, this area displays current
cursor time.
(4) Scroll bar: indicates the position of currently displayed trend data in all the trend data.
(5) Cursor: shows your current position in the trend page. When the cursor is moved across the timeline, the values
measured at the cursor time are shown in the right column.