Inspecting with Color Data Inspection Item
FQ2-S/CH User’s Manual
299
4
Setting Up Inspections
Measurement Data That Can Be Logged (Color Data)
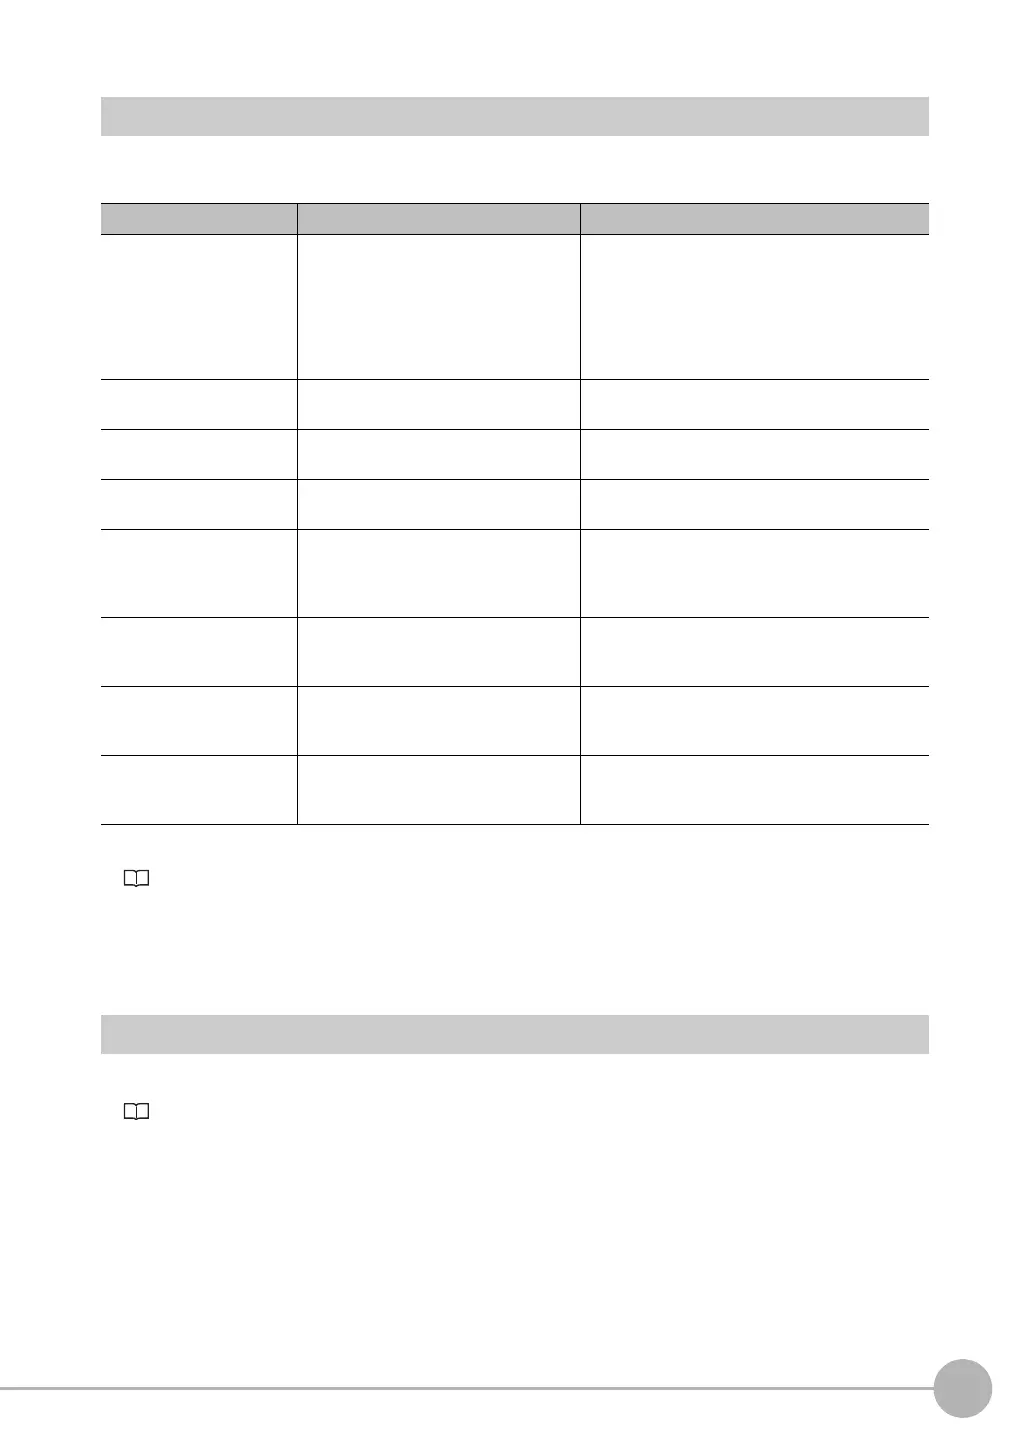
The following values can be logged as measurement data.
* When logging data is output, the data is output in the order of the above table.
7-6 Logging Measurement Data and Image Data: p. 392
Increasing Processing Speed for Color Data
Make the measurement region smaller to reduce the processing time.
Changing the measurement region: p. 227
Measured item Range of value Description
Judgement
0: Judgement is OK,
−1: Judgement is NG
−10: Image error
−13: Teaching not performed error
−14: Figure not registered error
−15: Out of range error
−20: Other error
This is the measurement judgment results.
R average 0 to 255 This is the average value for the R (red) compo-
nent.
G average 0 to 255 This is the average value for the G (green) compo-
nent.
B average 0 to 255 This is the average value for the B (blue) compo-
nent.
Color diff./dens. AV. Color
(for Sensors with Color
Cameras)
0 to 442
This is the difference between the color that was
registered as the reference and the measured color.
The average color within the measurement area is
used in both cases.
Color diff./dens. AV. Color
(for Sensors with Mono-
chrome Cameras)
0 to 255
This is the difference between the average density
in the region and the currently measured density.
Clr. deviat.
(for Sensors with Color
Cameras)
0 to 221
This is the deviation within the measurement
region.
Clr. deviat.
(for Sensors with Mono-
chrome Cameras)
0 to 127 This is the deviation in the average density in the
measurement region.
 Loading...
