Checking the Trend of Measurement Results with Graphs
358
FQ2-S/CH User’s Manual
6-3 Checking the Trend of Measurement Results with Graphs
FQ2-S3 FQ2-S4
Measurement result histories can be checked using the trend monitor and histograms.
To display trend monitors or histograms in Run Mode, you must make the following setting in advance in Setup
Mode.
(Setup Mode) − [TF settings] − [Logging setting] − [ON]
Trend Monitor
Changes in the measurement values of the selected inspection item against time can be observed from the
graph. It becomes possible to predict when malfunctions may occur or to analyze the cause of the malfunction
by checking the trends in the measurement values. The most recent 1,000 measurement values are displayed
on the graph.
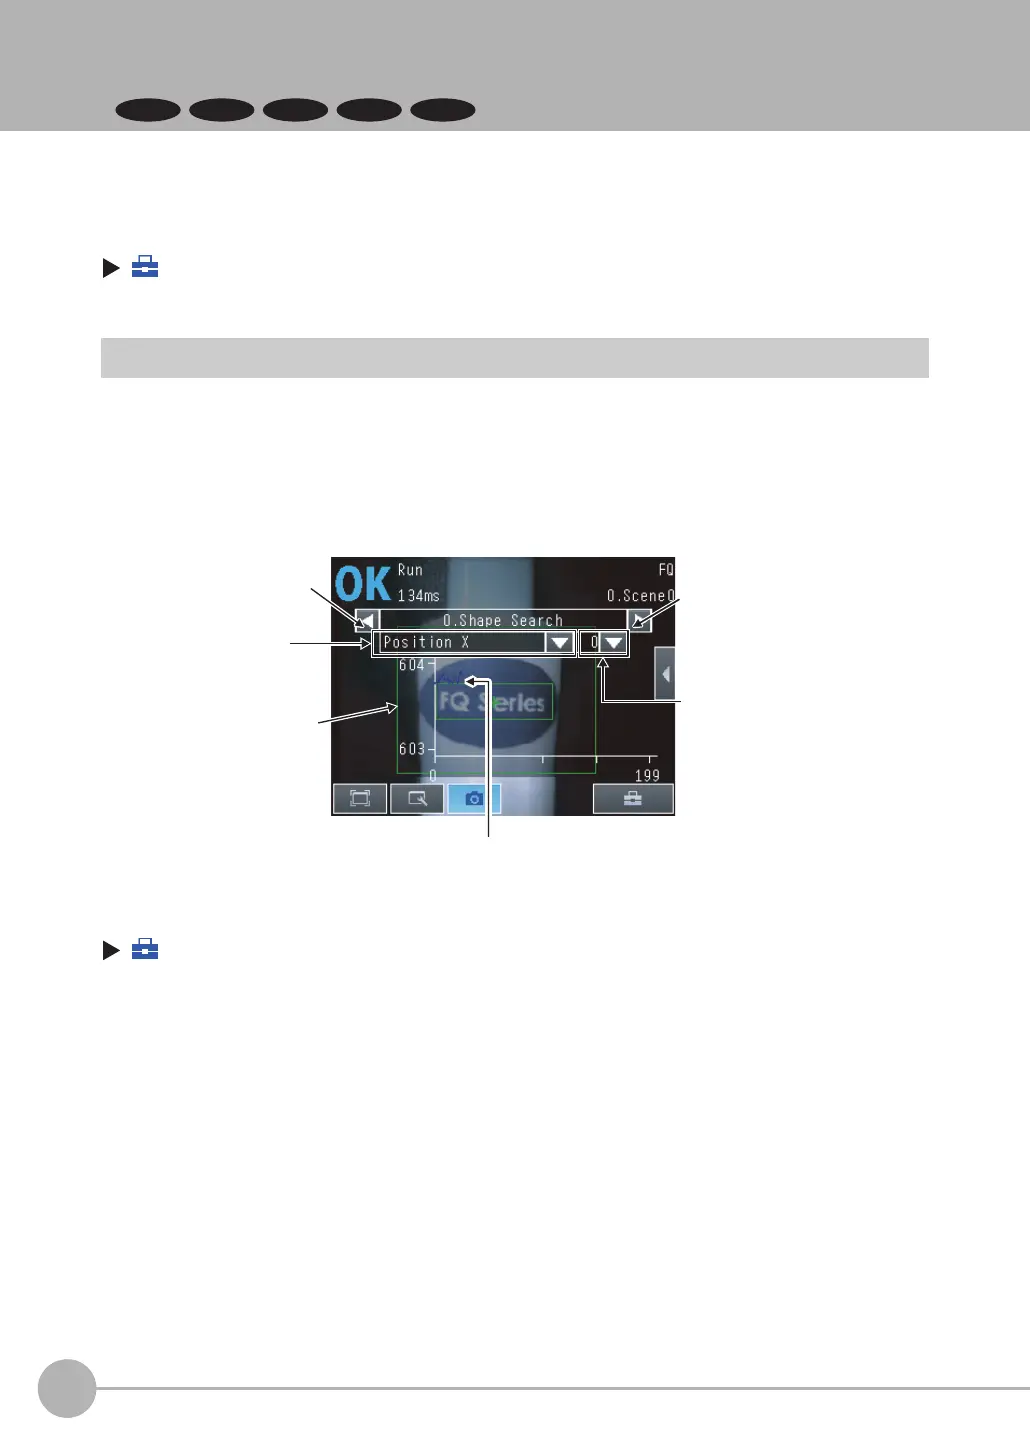
• [Trend monitor] Display
(Run Mode) − [Select display] − [Trend monitor]
Changes in the measured value of the selected
inspection item are displayed against time in a graph.
Measurement
values
Switches the display to
the previous inspection
item number.
Switches the display to the
next inspection item number.
Specifies the
parameters to display
on the Trend Monitor.
Used to select the
detection information to
display when more
than one detection
point is detected at the
same time for one item.
(FQ2-S series only)
 Loading...