QUALITY CONTROL, Manual QC Analysis
6-42 Sysmex SF-3000 Operator's Manual -- Revised December 1995
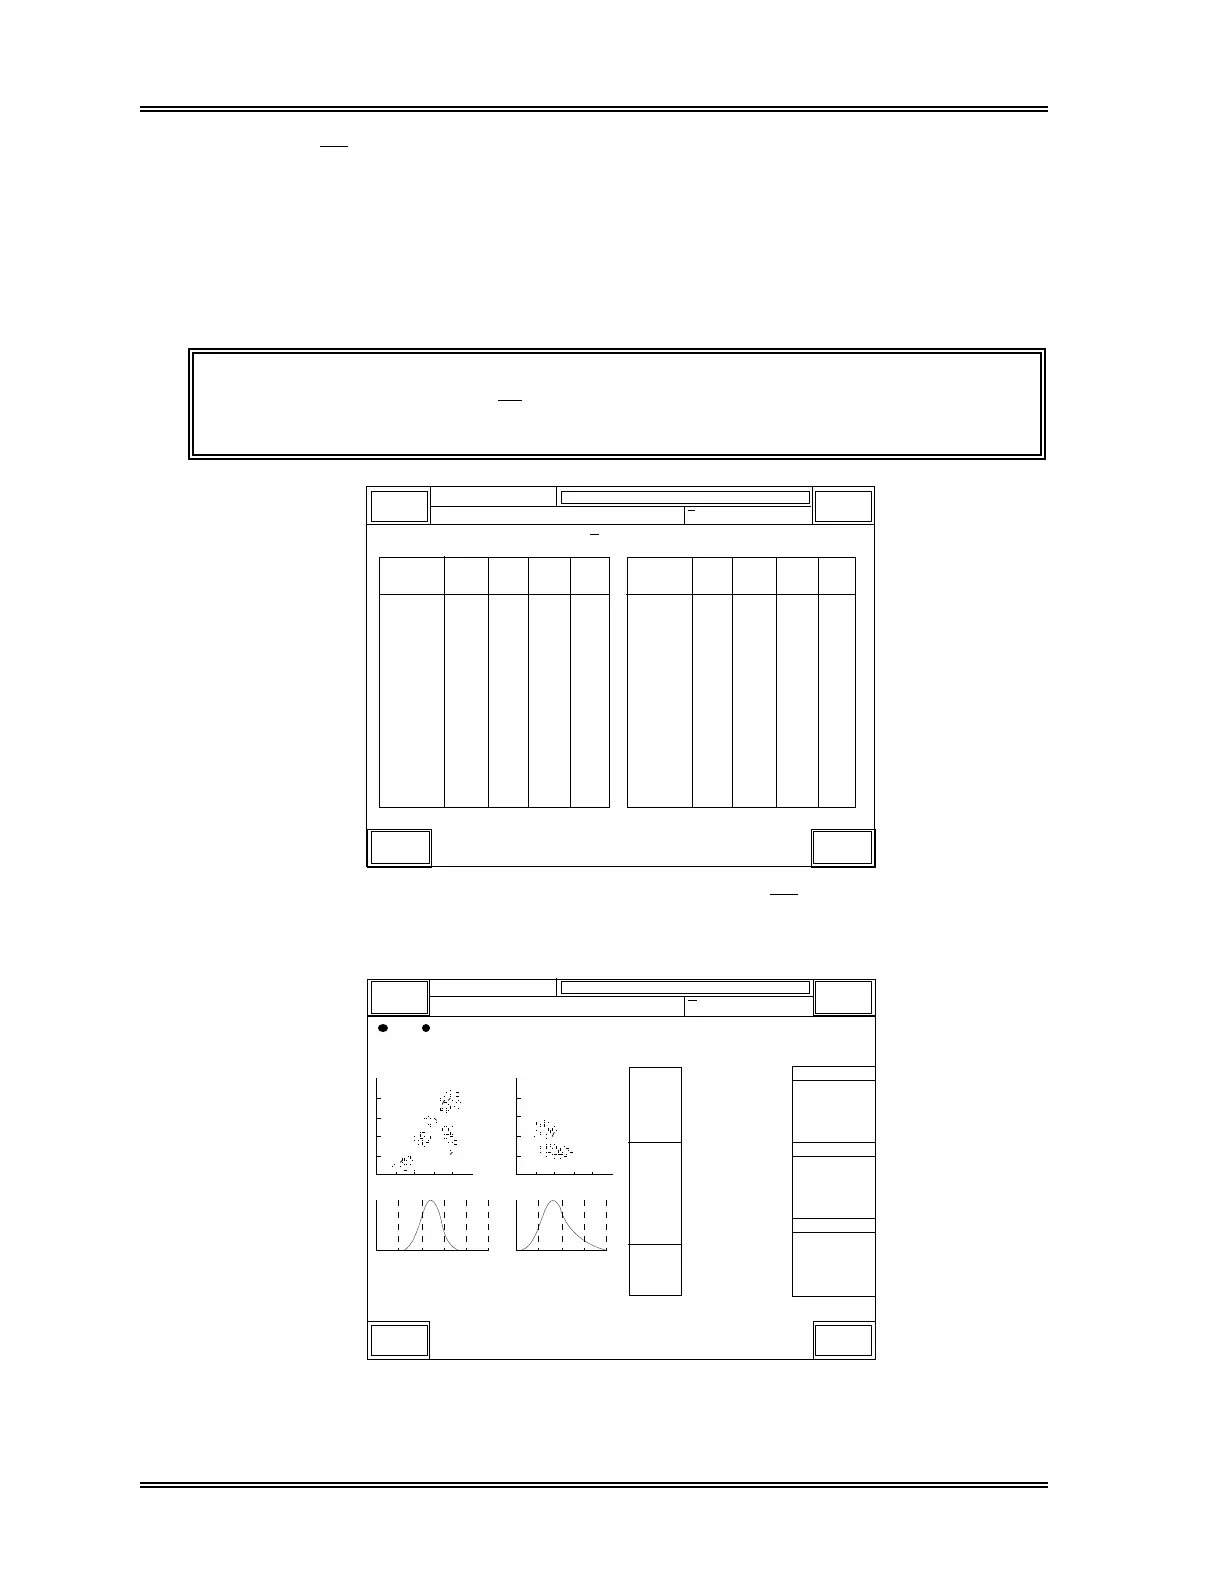
• When X program is used:
The results of the first analysis is displayed in the "X1" column when completed.
The sample No. on the graphic screen is shown, for example, as "QC01-1".
When the second analysis is completed, the results are displayed in "X2" column.
Then, the mean (average) values of the first and the second analysis results will be
displayed in the "Mean" column. Refer to Figure 6-38b. The sample No. on the
graphic screen is indicated as "QC01" (see Figure 6-38c).
NOTE: Two analysis results obtained consecutively without any abnormality
are used for the X
Control.
Sysmex
DP:1234567890123
XM HC GP DP SU
Ready
Manual Mode Next No. 1234567890123
Sampler
Judg-
ment
X1 X2
Mean
MeanX2X1
Judg-
ment
WBC
RBC
HGB
HCT
MCV
MCH
MCHC
RDW-SD
RDW-CV
PLT
PDW
MPV
P-LCR
QC01 < X Control >
NEUT#
LYMPH#
MONO#
EO#
BASO#
NEUT%
LYMPH%
MONO%
EO%
BASO%
GRAN-X
GRAN-Y
WBC/BA-X
WBC/BA-Y
GRAN-Y(W)
Graphic Return
7.25
4.79
14.0
41.2
87.5
29.8
33.3
46.0
15.3
214
9.8
10.0
23.7
7.21
4.69
14.1
42.0
88.1
29.6
34.5
46.8
16.1
212
9.8
10.6
24.9
7.23
4.74
14.1
41.6
87.8
29.7
33.9
46.4
15.7
213
9.8
10.3
24.3
4.62
1.55
0.71
0.18
0.17
63.9
21.4
9.8
2.5
2.4
177.4
177.2
44.2
94.7
43.0
4.61
1.56
0.67
0.18
0.19
63.9
21.6
9.3
2.5
2.6
177.4
177.1
44.1
94.6
43.0
4.63
1.54
0.75
0.17
0.16
63.9
21.2
10.3
2.4
2.2
177.4
177.3
44.2
94.8
43.0
Figure 6-38b: QC Data Display Screen ( X Control)
XM
QC01
Last
NO.
R B C P L T
D I F F W B C / B A S O
[g/dL]
[fL]
WBC
NEUT
LYMPH
MONO
EO
BASO
RBC
HGB
HCT
MCV
MCH
MCHC
RDW-SD
RDW-CV
PLT
PDW
MPV
P-LCR
250fL 40fL
RBC Flag
PLT Flag
WBC Flag
DP:1234567890123
Sysmex
Ready
Sampler
3
[x10 /uL]
[%]
[%]
[%]
[%]
[%]
6
[x10 /uL]
[g/dL]
[%]
[%]
[%]
[fL]
[fL]
[fL]
3
[x10 /uL]
[pg]
Manual Mode
Next No.1234567890123
HC GP DP SU
7.23
4.62
1.55
0.71
0.18
0.17
4.74
14.1
41.6
87.8
29.7
33.9
46.4
15.7
213
9.8
10.3
24.3
63.9
21.4
9.8
2.5
2.4
R:0000-00 15:48 1996/6/30
QC Data Return
Figure 6-38c: Control Data Graphic Display