SAMPLE PROCESSING, QC: Manual Mode
Sysmex SF-3000 Operator's Manual -- Revised December 1995 2-11
• When L-J Control program is used:
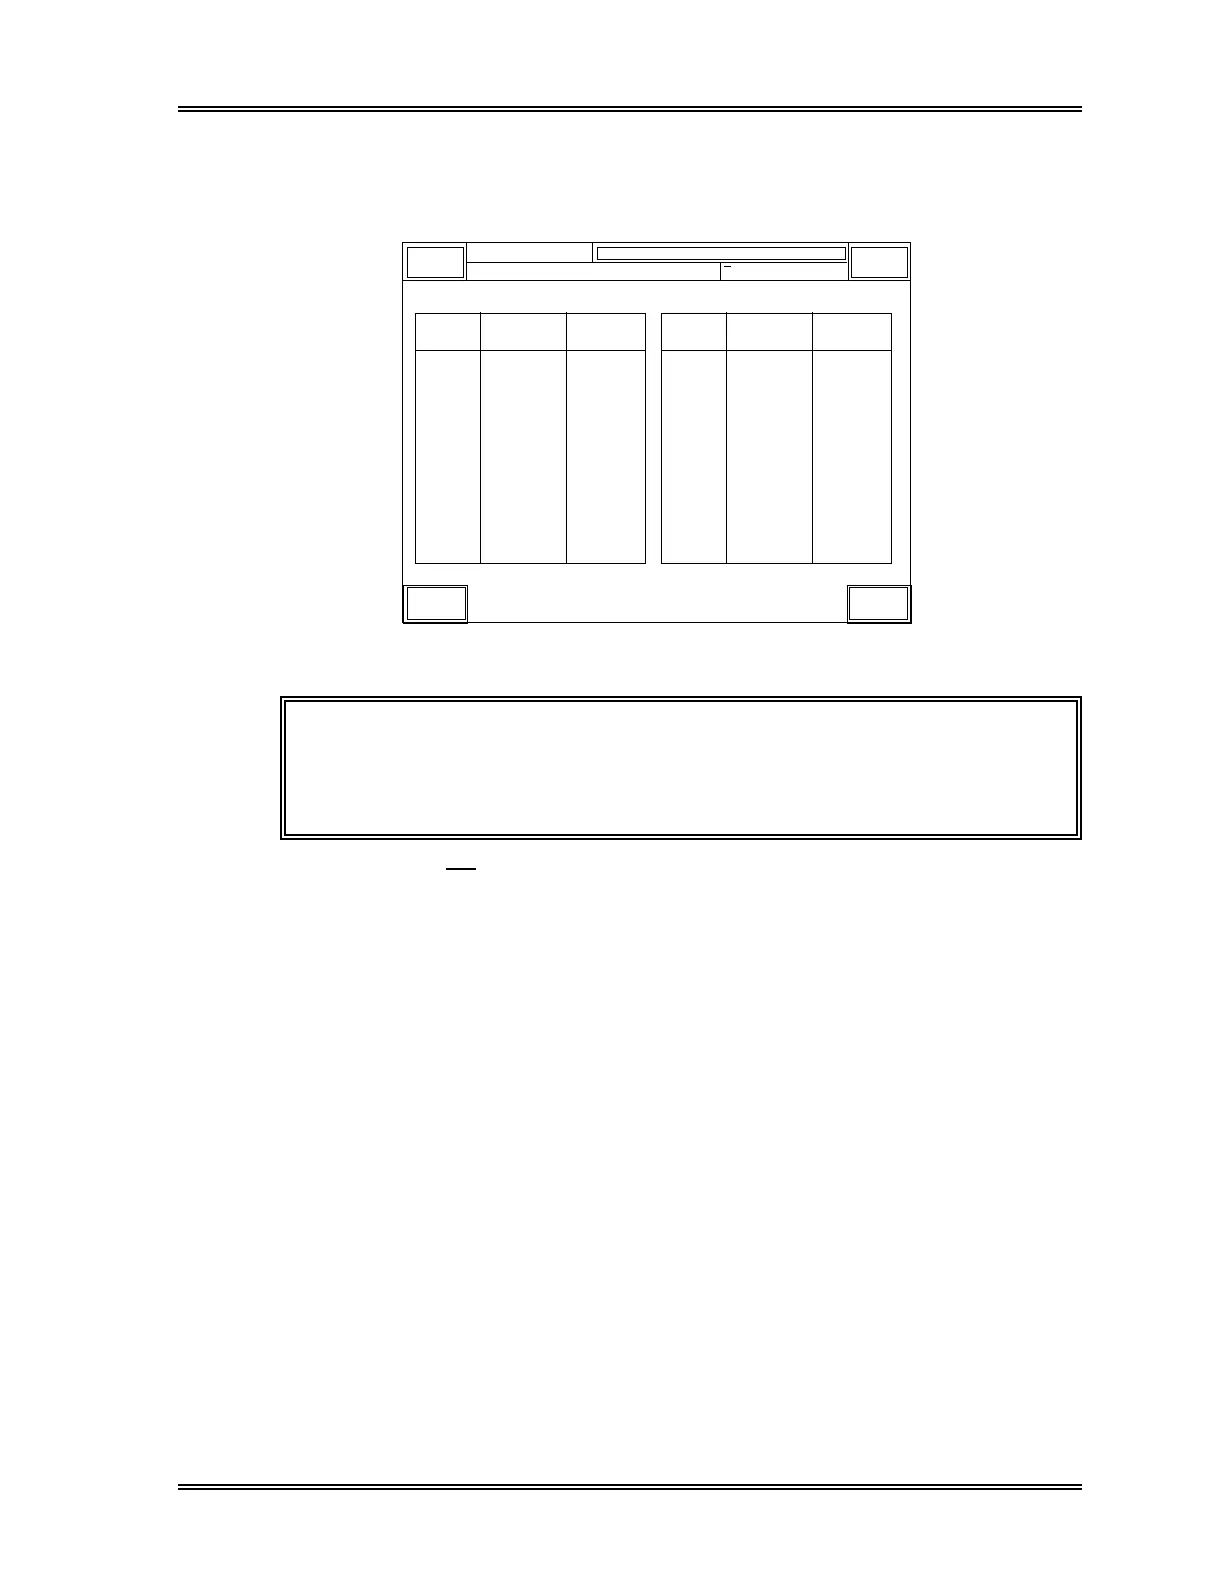
The QC analysis results are displayed as shown in Figure 2-6. The sample No. on
the graphic display is indicated as "QC01".
Sysmex
DP:1234567890123
XM HC GP DP SU
Ready
Manual Mode Next No. 1234567890123
Sampler
JudgmentData
WBC
RBC
HGB
HCT
MCV
MCH
MCHC
RDW-SD
RDW-CV
PLT
PDW
MPV
P-LCR
QC01 < L-J Control >
NEUT#
LYMPH#
MONO#
EO#
BASO#
NEUT%
LYMPH%
MONO%
EO%
BASO%
GRAN-X
GRAN-Y
WBC/BA-X
WBC/BA-Y
GRAN-Y(W)
Graphic Return
7.23
4.74
14.1
41.6
87.8
29.7
33.9
46.4
15.7
213
9.8
10.3
24.3
4.62
1.55
0.71
0.18
0.17
63.9
21.4
9.8
2.5
2.4
177.4
177.2
44.2
94.7
43.0
JudgmentData
Figure 2-6: QC Data Display Screen (L-J Control)
NOTE: If the displayed results are not acceptable, re-enter the QC File
No. as "QC01" and re-analyze the control. The data in the
"Data" column will be replaced with the newly obtained results,
and the new data will be handled as the L-J Control data.
If the error message < X Limit Error> or <L-J Limit Error> appears in the system status
area (upper portion of the LCD), the analyzed data has exceeded the control limit.
The "+" or "-" sign in yellow backlight will be displayed in the "Judgment" column and
the "Check Control Chart" message window appears. On the graphic display, the "+" or
"-" sign in yellow backlight will also be added to the parameter which is outside the
control limits. Check the control chart and review the control data. Reanalyze the
sample, if needed. Refer to Chapter 6: Quality Control.
When the message "Reanalyze Control" appears, the analyzed data is more than 3 times
the limit and will not be recorded in memory. The "+" or "-" sign in red backlight will be
displayed in the "Judgment" column. On the graphic display, the "+" or "-" sign in red
backlight will also be added to the parameter which is outside the control limits.
Reanalyze the sample.
If an analysis error occurs during QC analysis, the error message <QC Analysis Error>
will be displayed. The results are not plotted as a control data point. Reanalyze the
sample.