SAMPLE PROCESSING, QC: Manual Closed Mode
2-14 Sysmex SF-3000 Operator's Manual -- Revised December 1995
Sysmex
DP:1234567890123
XM HC GP DP SU
Ready
Closed Mode Next No. QC03-1
Sampler
Judg-
ment
X1 X2
Mean
MeanX2X1
Judg-
ment
WBC
RBC
HGB
HCT
MCV
MCH
MCHC
RDW-SD
RDW-CV
PLT
PDW
MPV
P-LCR
QC03 < X Control >
NEUT#
LYMPH#
MONO#
EO#
BASO#
NEUT%
LYMPH%
MONO%
EO%
BASO%
GRAN-X
GRAN-Y
WBC/BA-X
WBC/BA-Y
GRAN-Y(W)
Graphic Return
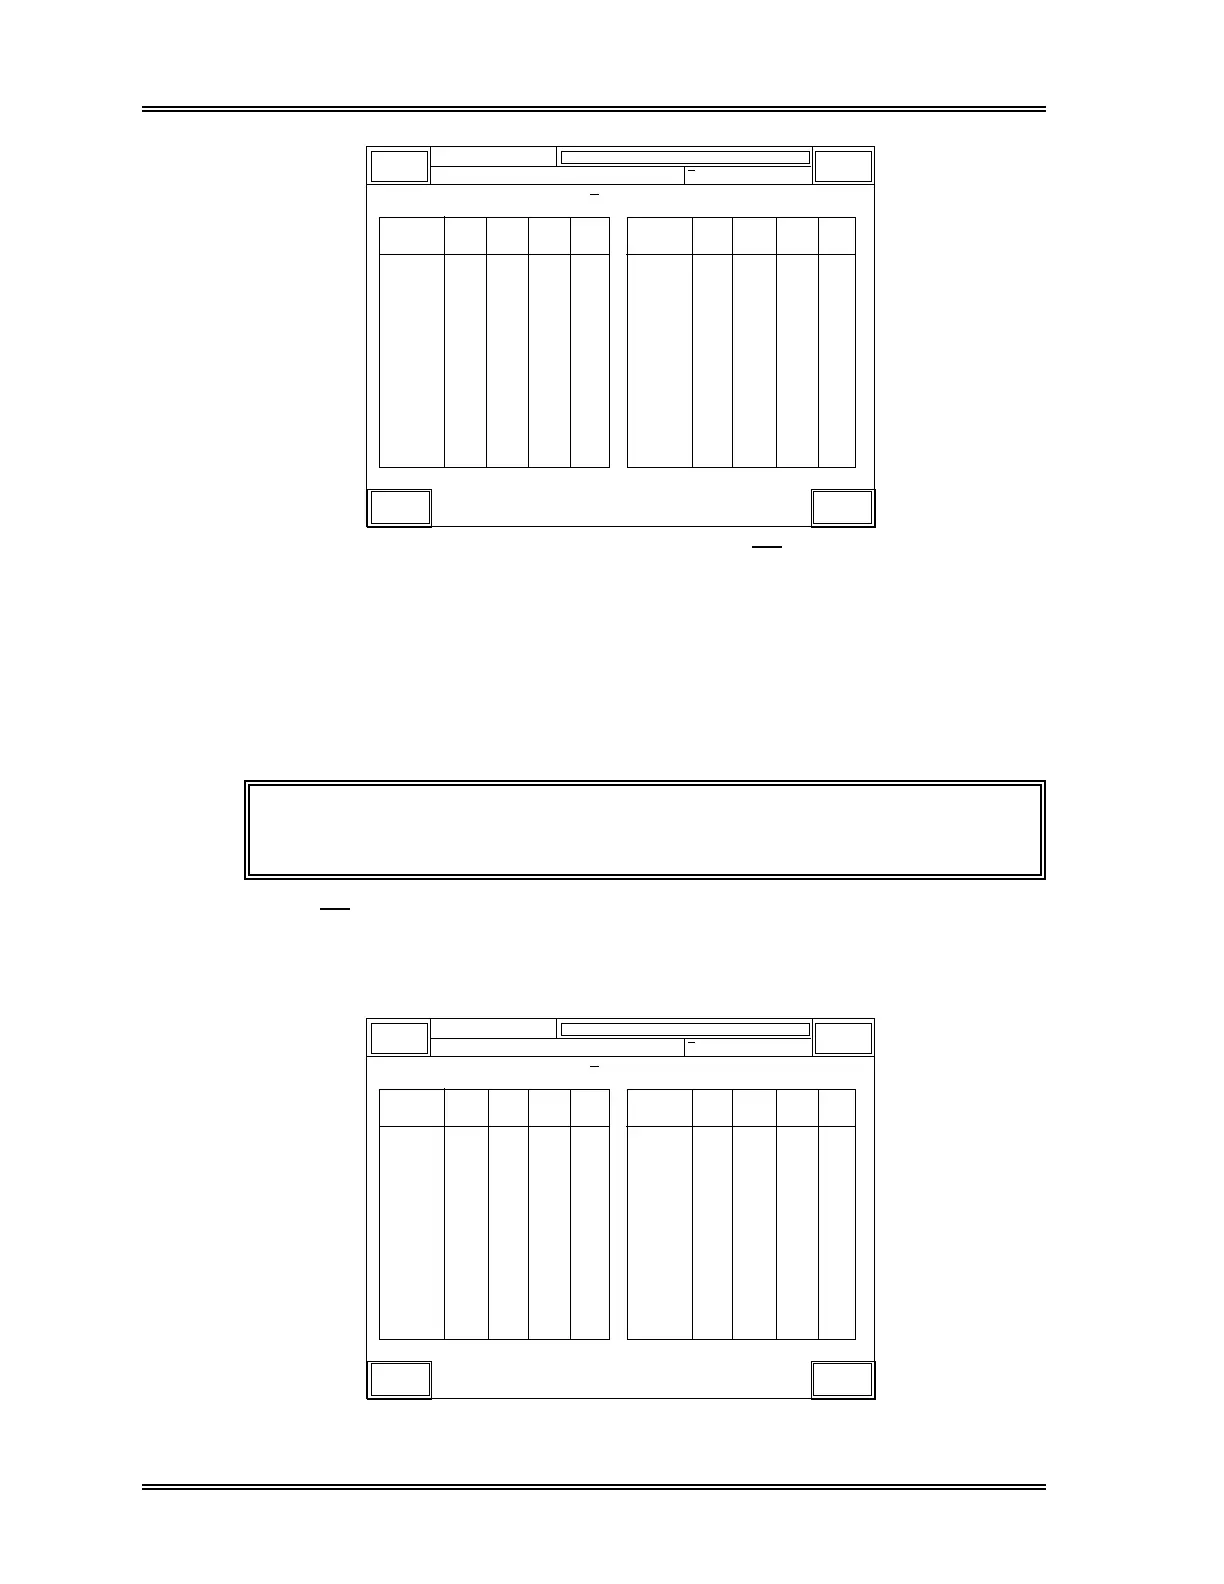
Figure 2-8: QC Data Display Screen ( X Control)
(6) To analyze the control material in the Manual Closed mode, see Section 4.4:
Manual Closed Mode in this chapter.
(7) After the analysis is completed, the results are displayed.
When the [Return] key is pressed, the program ends and the control data is
automatically accepted and plotted.
NOTE: Press the [Graphic] key on the QC Data Display screen to
display the graphic display.
• When X Control program is used:
The results of the first analysis are displayed in the "X1" column when completed.
The sample No. on the graphic screen is shown, for example, as "QC03-1".
Sysmex
DP:1234567890123
XM HC GP DP SU
Ready
Closed Mode Next No. QC03-2
Sampler
Judg-
ment
X1 X2
Mean
MeanX2X1
Judg-
ment
WBC
RBC
HGB
HCT
MCV
MCH
MCHC
RDW-SD
RDW-CV
PLT
PDW
MPV
P-LCR
QC03 < X Control >
NEUT#
LYMPH#
MONO#
EO#
BASO#
NEUT%
LYMPH%
MONO%
EO%
BASO%
GRAN-X
GRAN-Y
WBC/BA-X
WBC/BA-Y
GRAN-Y(W)
Graphic Return
7.25
4.79
14.0
41.2
87.5
29.8
33.3
46.0
15.3
214
9.8
10.0
23.7
4.63
1.54
0.75
0.17
0.16
63.9
21.2
10.3
2.4
2.2
177.4
177.3
44.2
94.8
43.0
Figure 2-9a: "X1" Data Display (Closed Mode)