Keysight M8000 Series of BER Test Solutions User Guide 201
User Interface - M8020A Display Views 4
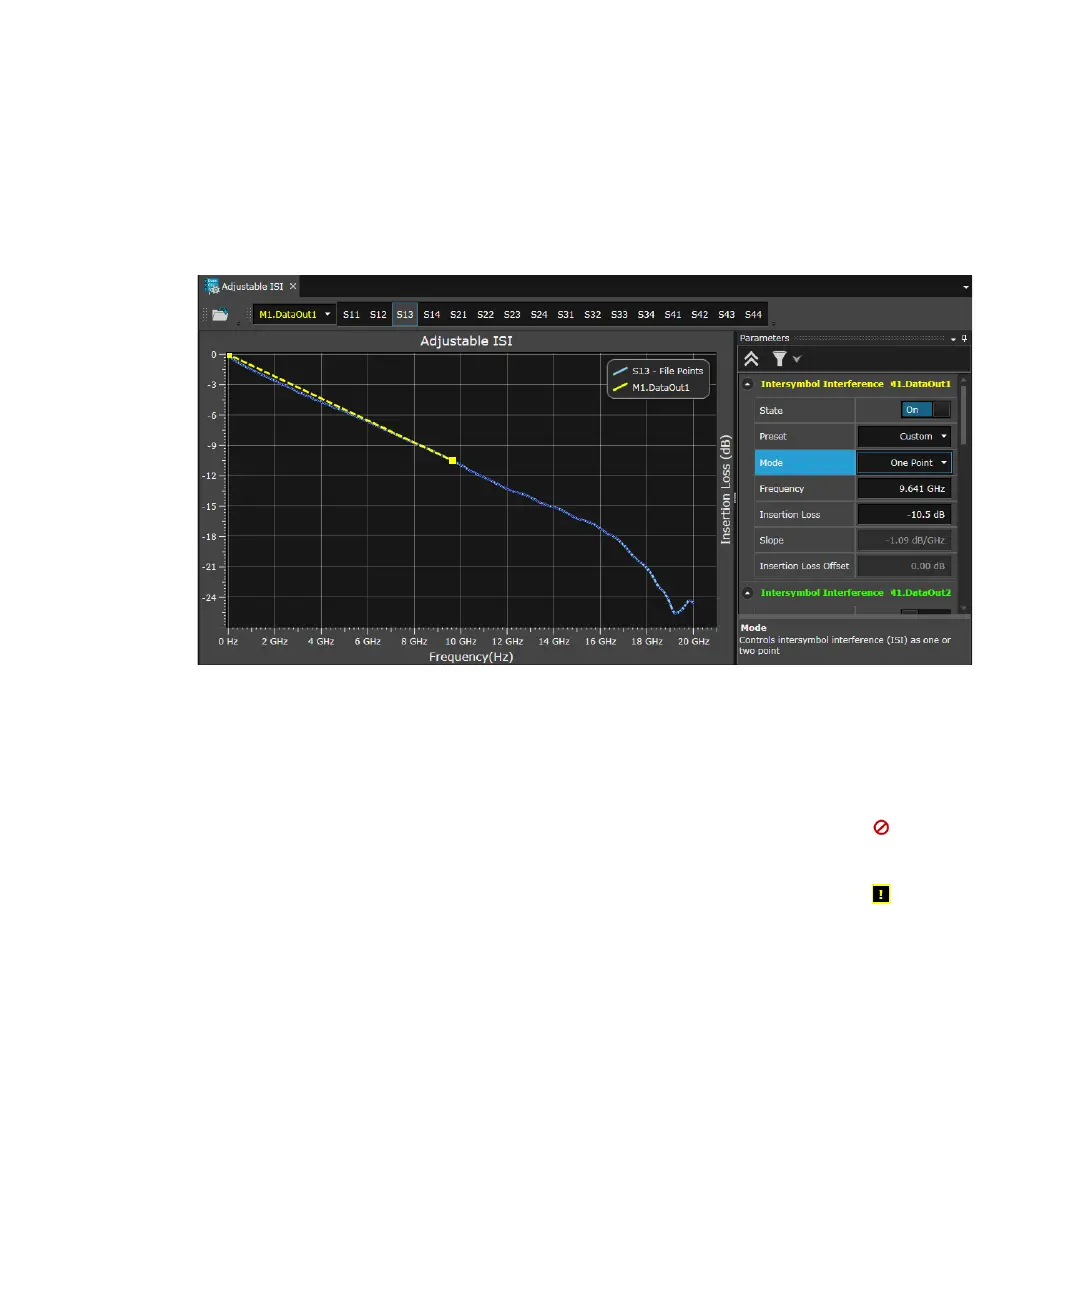
Adjustable ISI Graph
The following figure illustrates an ISI graph for 4-port system:
The ISI graph shows the insertion loss for a 2-port or 4-port system. The
values on the graph represents insertion loss with respect to frequency.
You can select the data points according to which you want to generate
the loss and then manipulate points graphically (mouse drag) or by
parameter window to draw the data point graph. Please note that if you
manipulate the points of the linear graph to the values which are not in the
defined limits of Slope and Offset, the pointer will change to icon. In
this case, the linear graph will switch to last set values. However, if you
manipulate the points of the linear graph to the values which are not in the
defined limits of Slope and Offset, the pointer will change to icon. In
this case, a message will appear at the bottom of the graph along with the
undo option to revert the graph changes.
ISI Parameters
The ISI parameters are summarized in the following list:
• State - Enables/disables the ISI state.
• Preset - Allows you to select preset for specific applications
representing a typical loss characteristic.