490 Keysight M8000 Series of BER Test Solutions User Guide
8 Working with Measurements
Measurement Graph
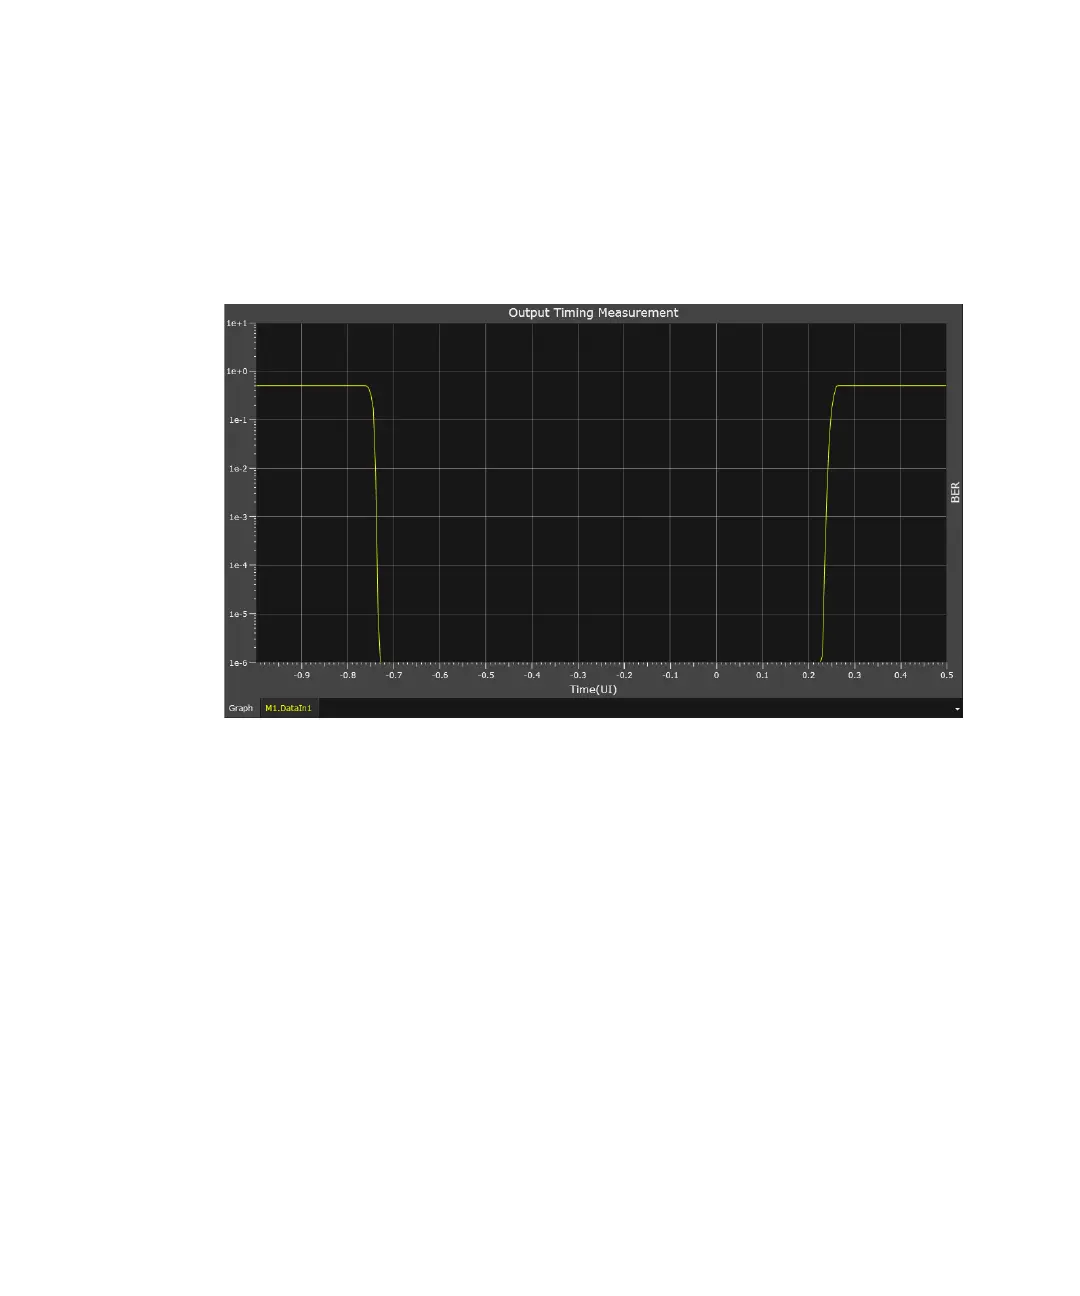
Once you run an Output Timing measurement for a specified duration, the
following graph is shown on the measurement graph:
The bathtub curve in the graph shows the overall jitter distribution over a
unit interval and serves as the basis for bit error rate estimation.
How an Output Timing Measurement Works
The sampling point is swept automatically within a 1.5 clock period to
generate a “bathtub” curve. The resulting graph is centered around the
optimum sampling point.
The BER Bathtub graph plots TJ (Total Jitter) data and BER values across
an entire bit period, which is labeled as the unit interval (UI) on the
horizontal axis. BER values are calculated using DJ and RJ and are used to
extrapolate to low BER levels. In general, the BER values will differ from
the measured TJ values at high probabilities, but the two should converge
at low probabilities. Jitter can be measured by moving the sampling point
across the eye pattern into the crossing region step by step.