526 Keysight M8000 Series of BER Test Solutions User Guide
8 Working with Measurements
Methods of Representation of Eye Diagram
There are two methods of representing the eye diagram:
•Waveform
•Contour
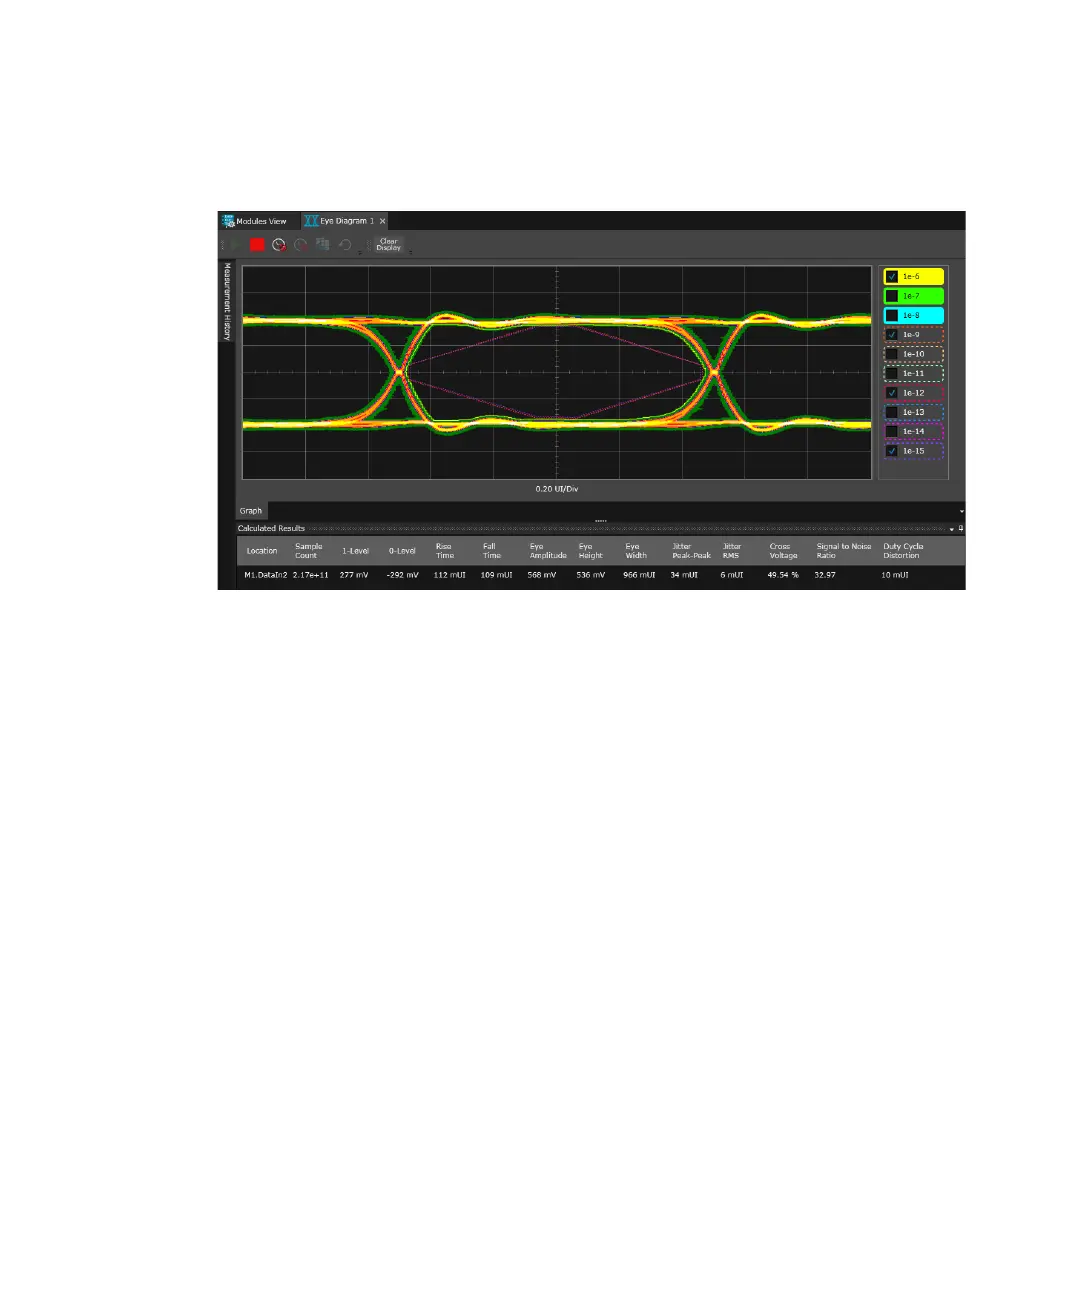
Waveform
Waveform is the shape, and form of a signal. The waveform graph shows
the periodical variation of voltage against time.
The waveform in the M8020A/M8030A is similar to the one in the
oscilloscope. In this case, the waveform initially gives a coarse, but quick
picture of the signal quality; while the ‘smooth waveform’ quickly
generates a high resolution graph. The waveform is displayed in an
incremental way, showing the coarse picture quickly, and then refining it
further.
The BER Threshold is configurable. The BER Threshold is the level up to
which the signal is represented as waveform, and BER values below this
threshold are represented as contours.
 Loading...