Keysight M8000 Series of BER Test Solutions User Guide 473
Working with Measurements 8
Display Change
During accumulation, data will appear to move from left to right on the
ratios graph. When the graph is completely filling the display, the x-axis
time scale will double. The data graph is then occupying only half of the
display and will continue to move to the right again. This will repeat until
the accumulation period has ended.
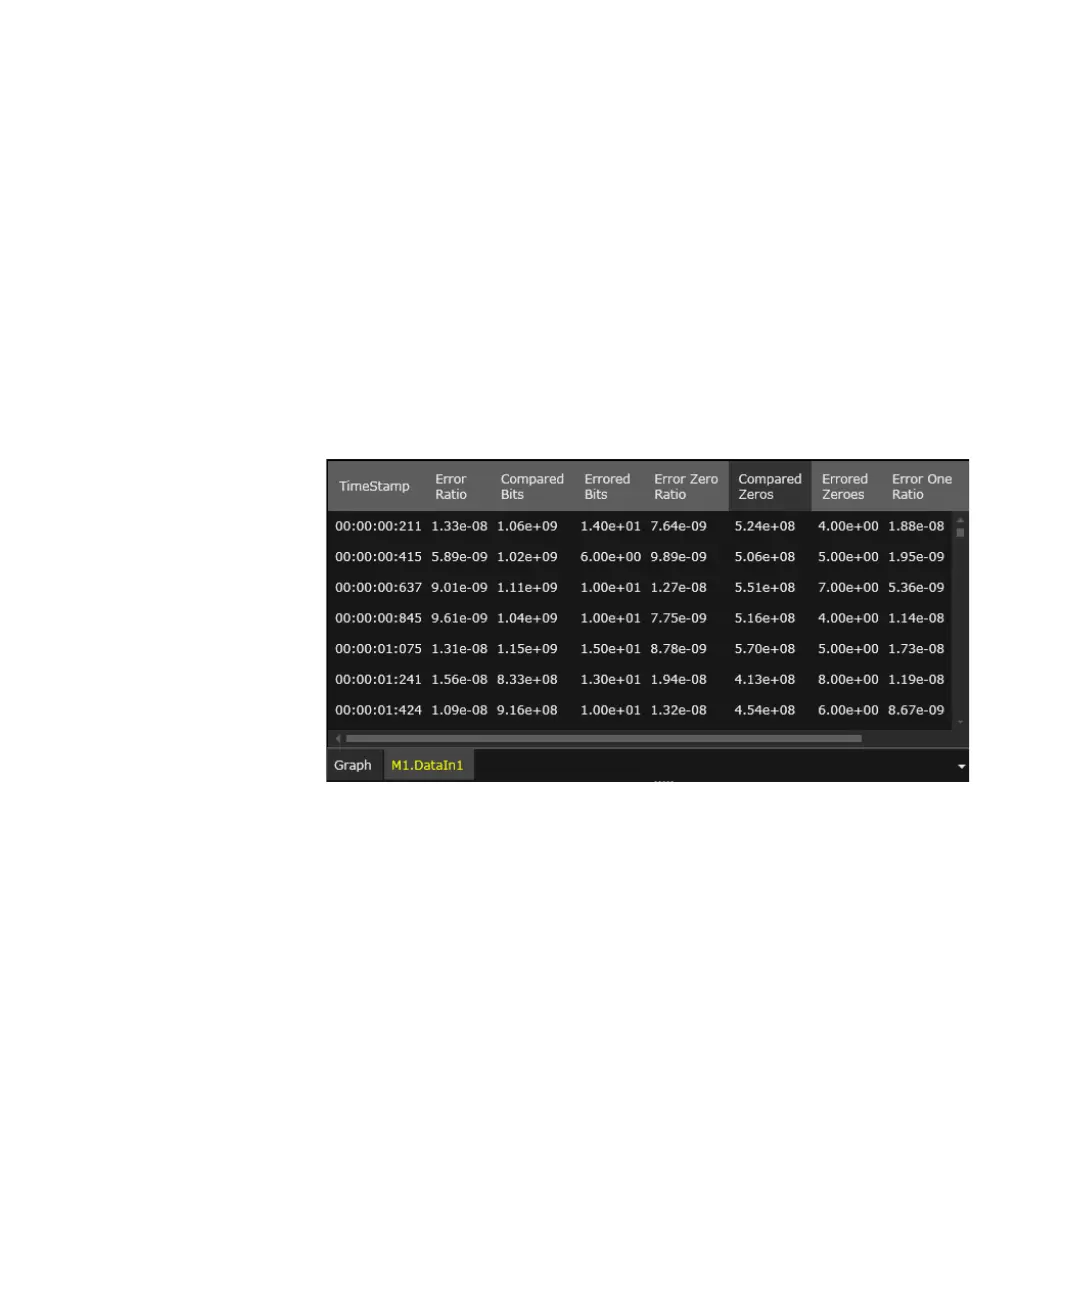
Measurement Data
The following figure shows the raw measurement data for the selected
location.
Test Times and Confidence Levels
A true Error Ratio measurement must be statistically valid. Because it is
not possible to predict with certainty when errors will occur, your device
must be tested long enough to have confidence in its Error Ratio
performance.

 Loading...