Keysight M8000 Series of BER Test Solutions User Guide 499
Working with Measurements 8
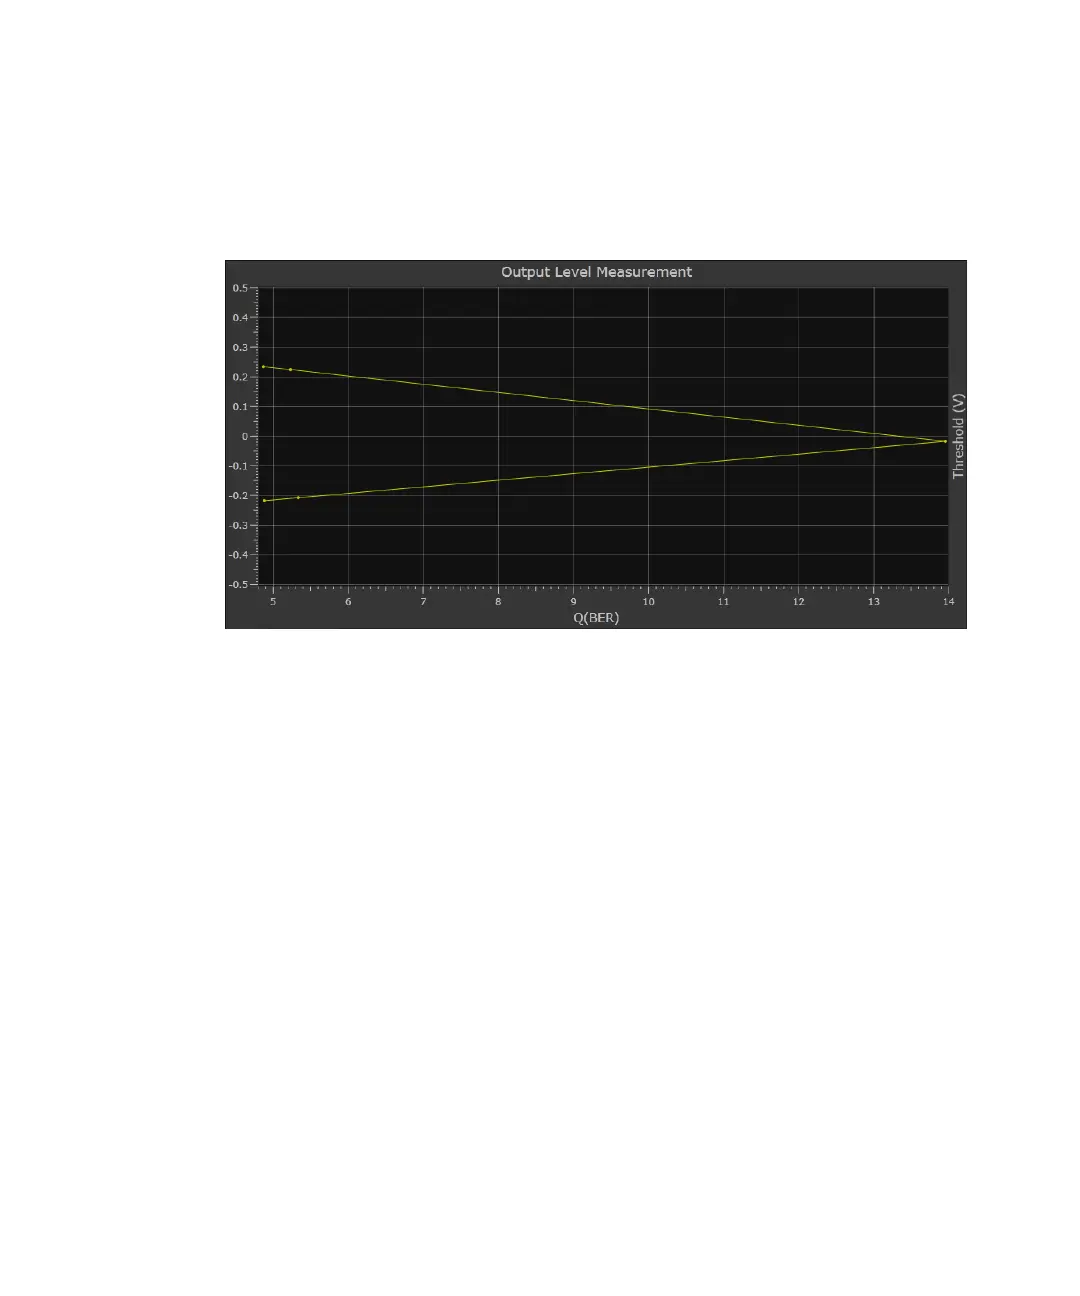
This graph illustrates the calculation of the Q-factor as the best fit line
through the calculated points.
Changing the Measurement Setting
• If you change the acquisition settings through Parameter window after
the measurement has been run, please note that the changes on the
parameters tab will take only effect if you run the measurement again.
• However, if you change the parameters that change the display of the
measured data (graphics, show measurement points and axis scale),
there is no need to repeat the measurement.
Available Views
The Output Levels measurement provides three different graphical views
to visualize the calculated results:
• BER versus Threshold:
This graph shows the relationship between the analyzer decision
threshold and the resulting BER. It presents the raw data.
• Q from BER versus Threshold:
This graph shows the extrapolation of the Q-factor and the optimum
threshold level from a limited number of measured points.
 Loading...