498 Keysight M8000 Series of BER Test Solutions User Guide
8 Working with Measurements
The BER considers all errors. It is calculated as:
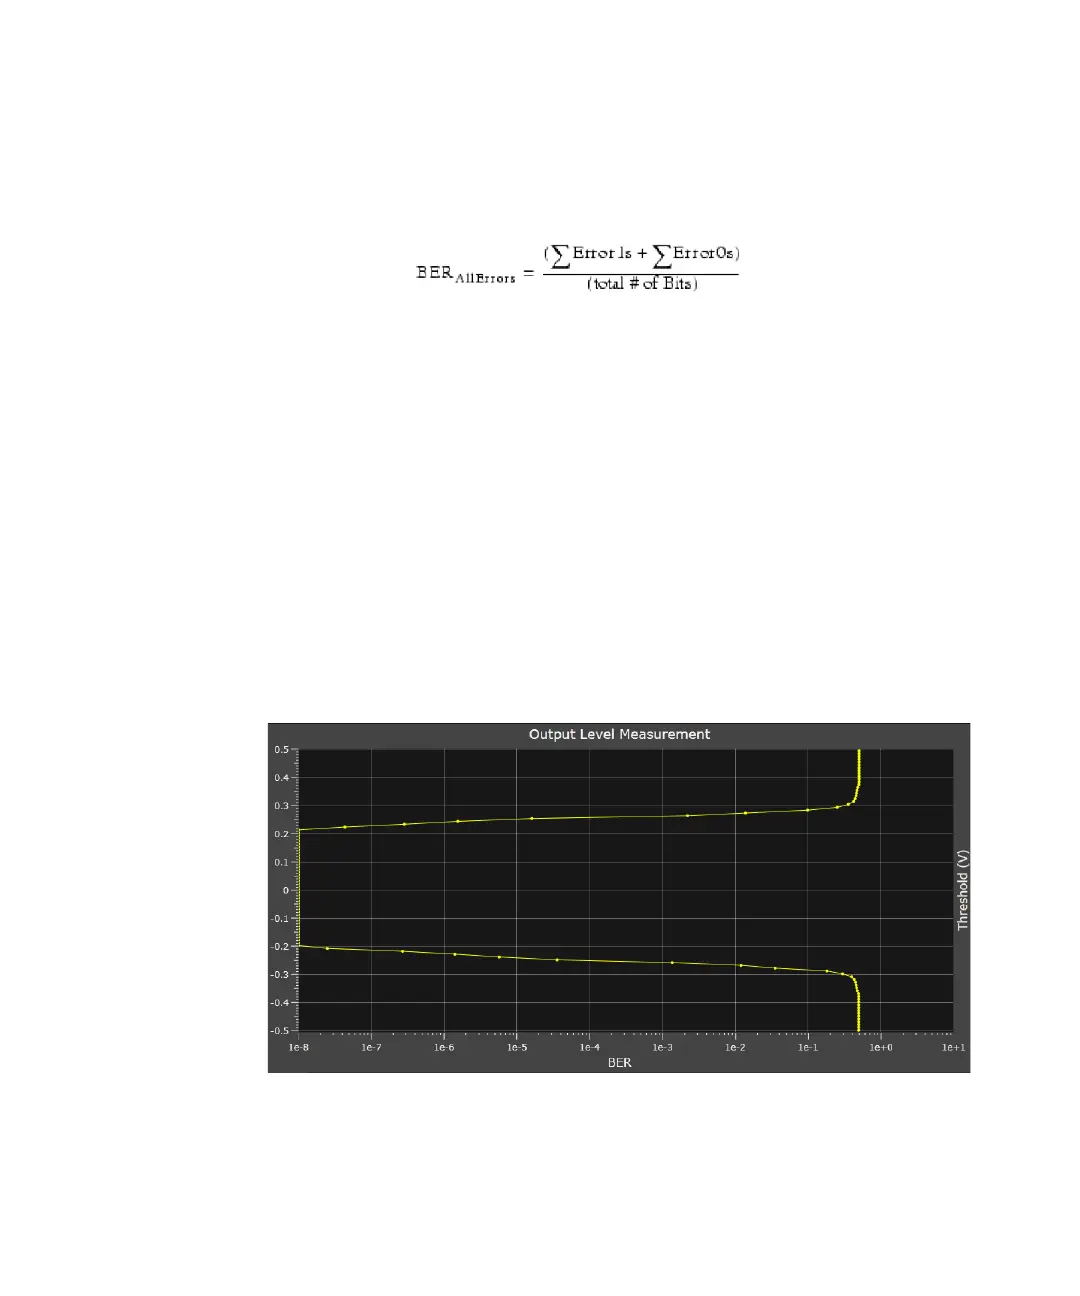
• QBER vs. Threshold Graph: This graph shows the extrapolation of the
optimum Q-factor and the optimum threshold level from a limited
number of measured points.
The measured data points to be used for the calculation have to be
within a contiguous BER range. This range is defined by specifying the
Min BER for Q (lower threshold) and the BER Threshold (upper
threshold). Both thresholds can be set in the lower section of the View
tab.
The Q-factor can only be calculated if for both high and low level rails
two or more points fall within the defined BER range. For reliable
results use at least five measured points.
To ensure proper settings, enable the Show Measured Points function
and switch to the BER vs. Threshold graph. Move the upper BER
threshold marker (vertical line) so that a sufficient number of measured
points is included for the calculation:
 Loading...