520 Keysight M8000 Series of BER Test Solutions User Guide
8 Working with Measurements
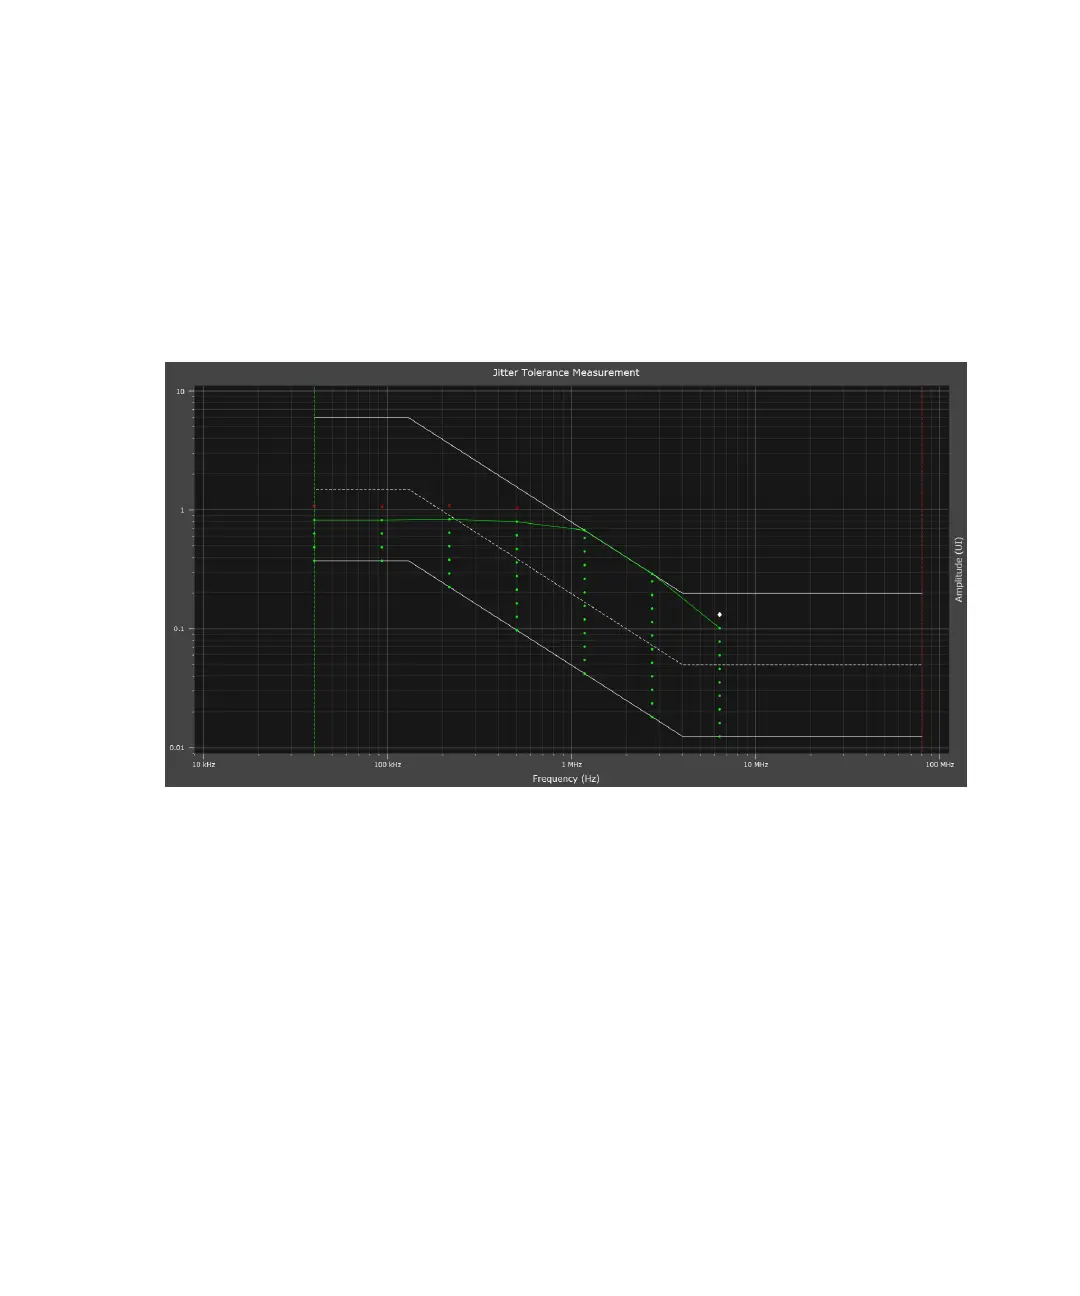
Measurement Graph
After a jitter tolerance measurement has been run, results can be viewed
by clicking on the Graph tab. The graph displays the sinusoidal jitter
frequency on the x-axis, and the sinusoidal jitter amplitude on the y-axis.
The following figure shows the measurement results in the graph view.
Result Points
The graph displays the BER measurement results of each tested sinusoidal
jitter point. Passing results are displayed as a green dot. If the Show All
Points option is enabled, all measured pass points will be shown by green
dots, else the only last passed result for a given frequency will be shown by
a green dot. If this green dot is selected, its respective measurement result
can be seen as highlighted in the Results tab and vice-versa. Also, a green
line connects the last passed result (green dot) of each frequency. In the
graph, the green “+” means that you’ve reached the instruments max jitter
capability without a fail. The red cross "x" means that you have failed to
reached the instruments max jitter capability.