Keysight M8000 Series of BER Test Solutions User Guide 521
Working with Measurements 8
Maximum and Minimum Template Limit Lines
The solid white lines on the graph show the search range during
characterization. This feature reduces test time by eliminating points
where the DUT is likely to pass when its performance range is known.
Template Points
The green dots on the graph are the measurement points defined in the
Template File.
Compliance Limit Line
The dashed white line on the graph shows the compliance test defined in
the Template File.
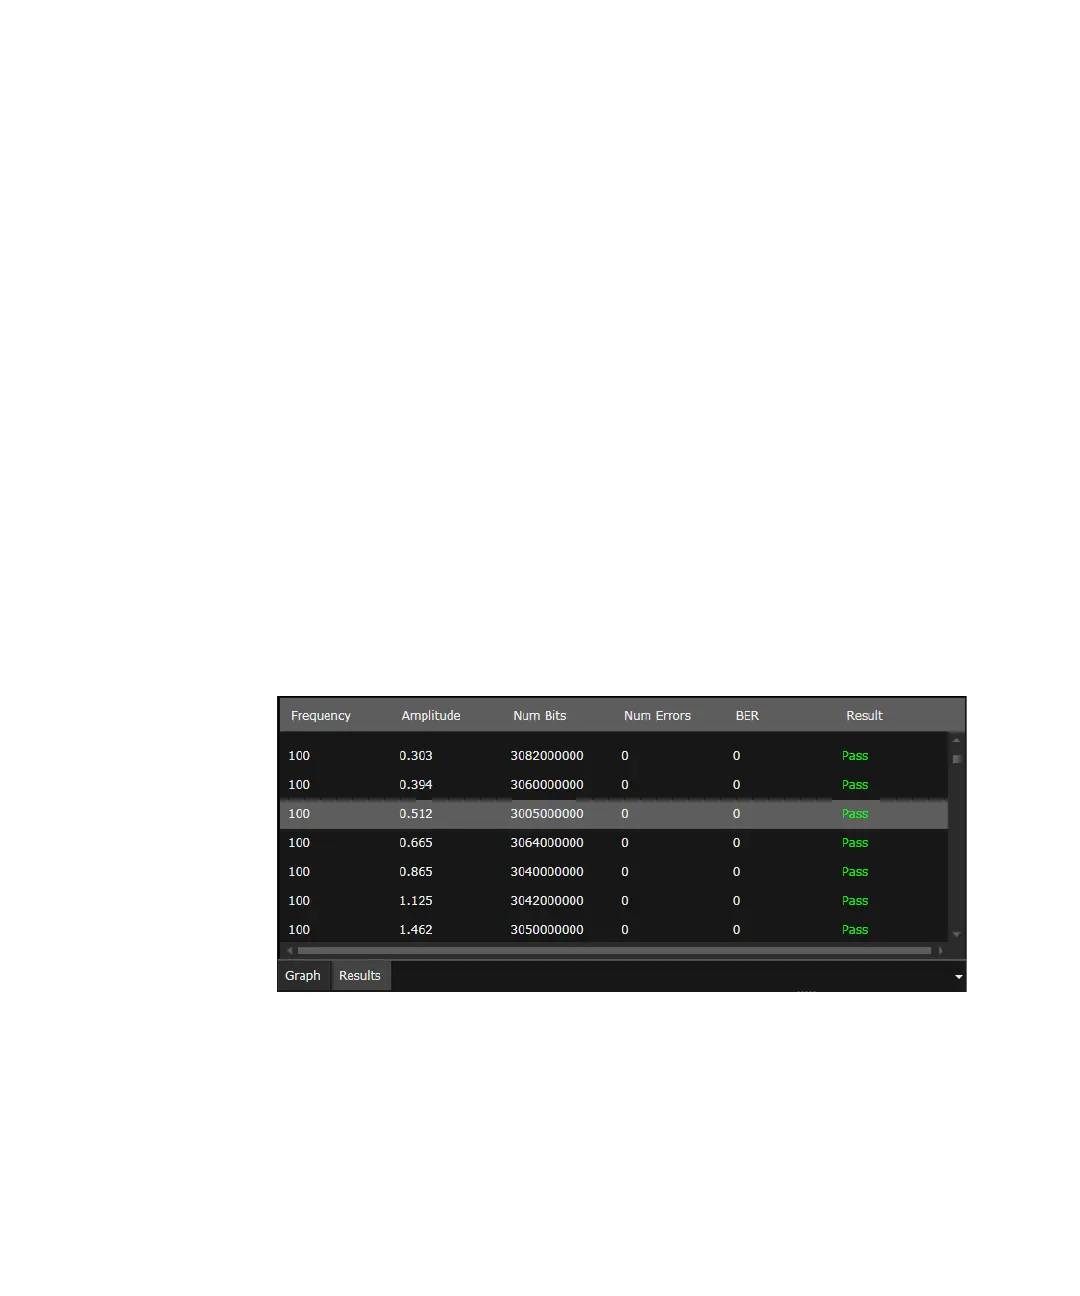
Viewing the Jitter Tolerance Results
Measurement results can also be viewed in tabular form by clicking on the
Results tab.
The following figure shows the results at each measurement point in
tabular form.
If a passed result point (green dot) on the measurement graph is selected,
its respective measurement results can be seen as highlighted in the
Results tab and vice-versa.
 Loading...