Keysight M8000 Series of BER Test Solutions User Guide 525
Working with Measurements 8
Eye Diagram Measurement
What is an Eye Diagram?
The M8070A System Software provides quick design analysis with the Eye
Diagram capability.
The Eye Diagram allows a quick check for the DUT’s signal output, and
determines the signal quality. The eye contour lines display the measured
eye at a deeper BER level, for accurate results.
The Eye Diagram feature provides the following measurement capabilities:
• Eye Diagram Waveform
• BER Contour Lines
• Automatic Measurement for the most relevant eye parameters:-
• Eye Height
• Eye Width
• Jitter P-P
• Jitter RMS
• Cross Voltage
The Eye Diagram generates a three dimensional graph of the bit error rate
(BER).
This measurement helps in determining and analyzing the quality of the
DUT’s signal output. The Eye Diagram results comprise of voltage(y),
time(x), and BER(z).
The Eye Diagram, and the table of Calculated Eye Measurement Results
form simultaneously. They become more precise with the increasing
number of measured bits.
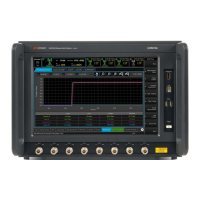
The following graph shows the Eye Diagram integrated in the M8070A
system software:

 Loading...


