Keysight M8000 Series of BER Test Solutions User Guide 501
Working with Measurements 8
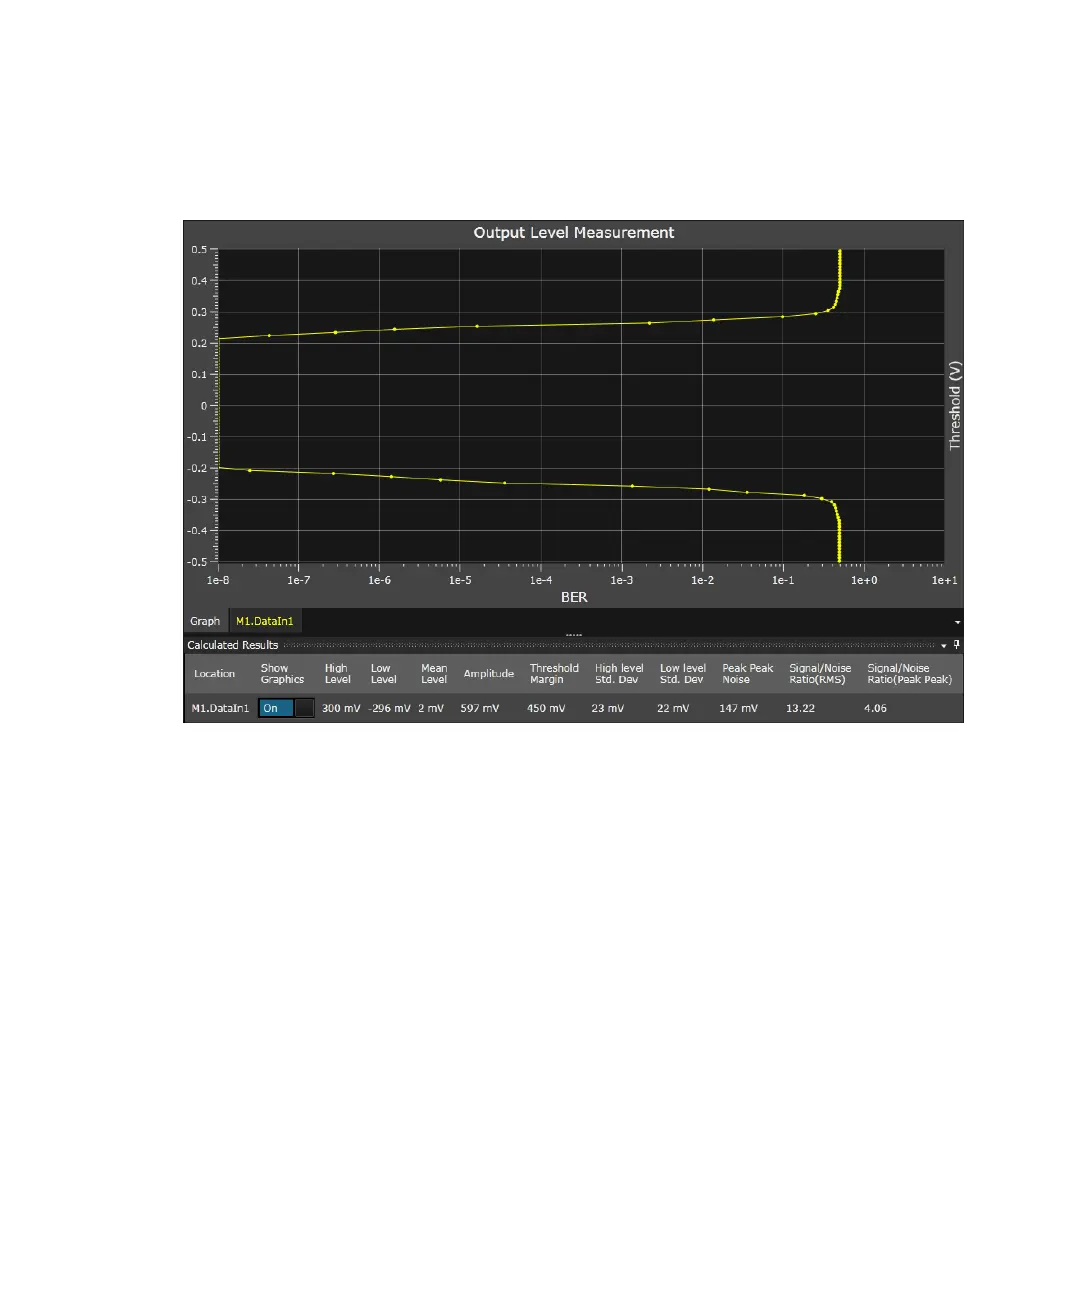
The Measurement Graph contains the following tabs:
• Graph: Displays the graphical representation of the measurement. The
graph varies from measurement to measurement. The details of each
measurement graph are further described in their respective sections.
• Location: Displays the raw measurement data for that location.
However, if you are running measurement for a group, multiple tabs will
appear that display the raw measurement for each location.
When you right-click on the Measurement Graph, a context menu
appears which provides the following options:
• Turn ON/OFF Fit to view (Ctrl+Home) - Turns ON/OFF Fit to view
option.
• Fit to view (Home) - Makes the visible area fit to display entire
contents.
• Copy screenshot (F11) - Copies the screenshot of charts to clipboard.
• Save screenshot (Ctrl+S) - Saves the screenshot as an image (PNG)
under a name.
 Loading...