538 Keysight M8000 Series of BER Test Solutions User Guide
8 Working with Measurements
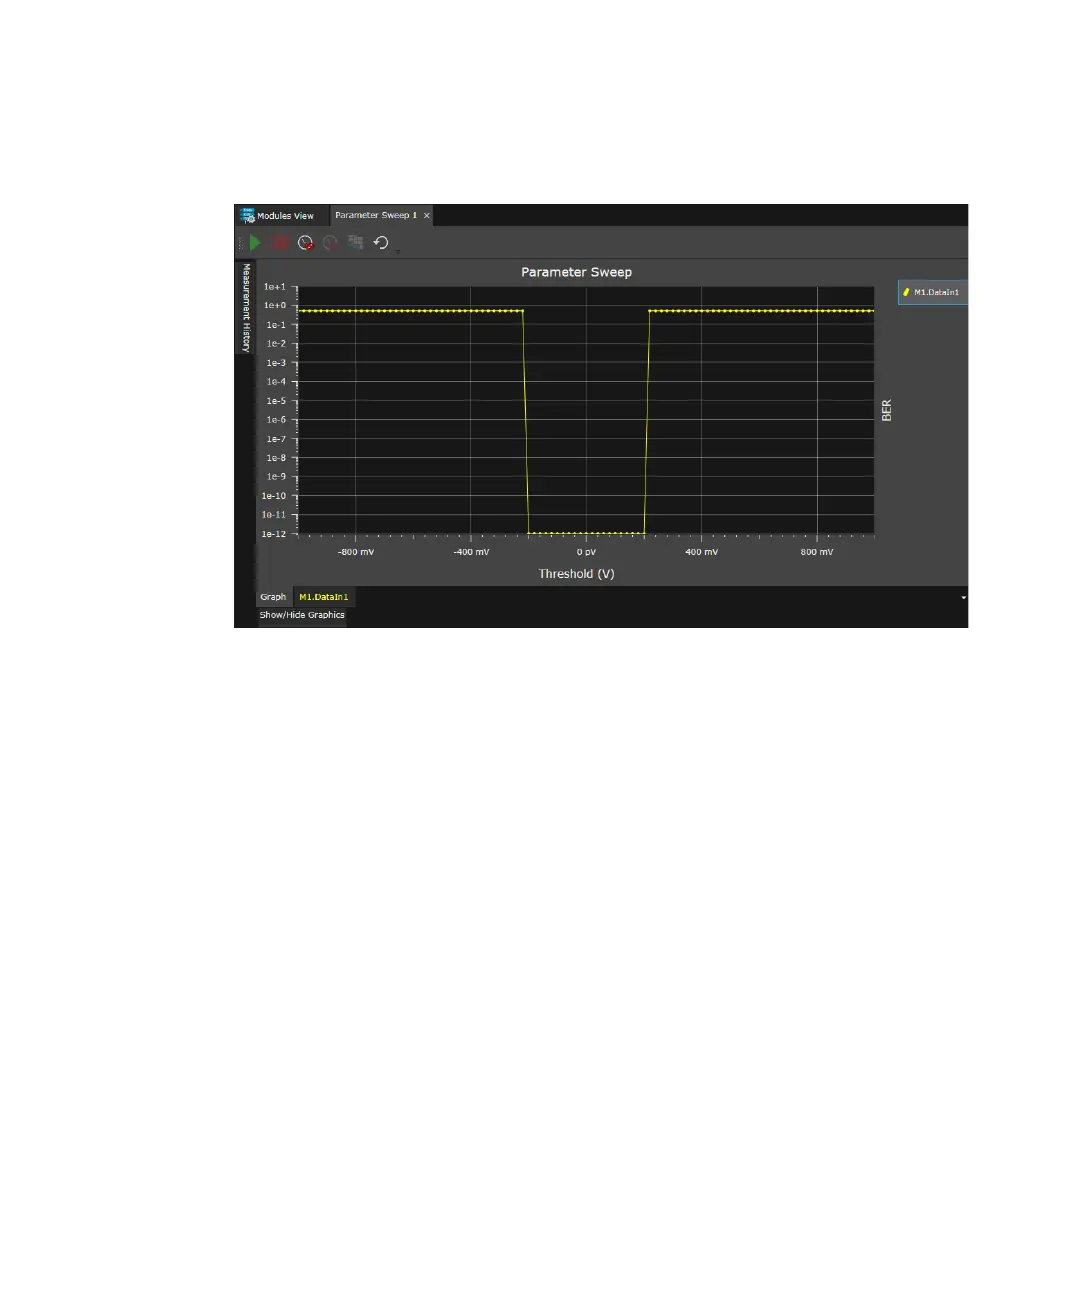
The Measurement Graph contains the following tabs:
• Graph: Displays the graphical representation of the measurement.
You can apply various graph settings to the selected graph to view it as
per the requirement. For graph settings, refer to Graph Setup on
page 536.
• Location: Displays the raw measurement data for the location/location
group. If you are running measurement for a group, multiple tabs will
appear that display the raw measurement for each location.
When you right-click on the Measurement Graph, a context menu
appears which provides the following options:
• Turn ON/OFF Fit to view (Ctrl+Home)- Turns ON/OFF Fit to view
option.
• Fit to view (Home) - Makes the visible area fit to display entire
contents.
• Copy screenshot (F11) - Copies the screenshot of charts to clipboard.
• Save screenshot (Ctrl+S) - Saves the screenshot as an image (PNG)
under a name.
• Quick Help (Alt+F1) - Opens a window that provides brief information
about the dynamic display.
 Loading...