Keysight M8000 Series of BER Test Solutions User Guide 327
Setting up Analyzer 6
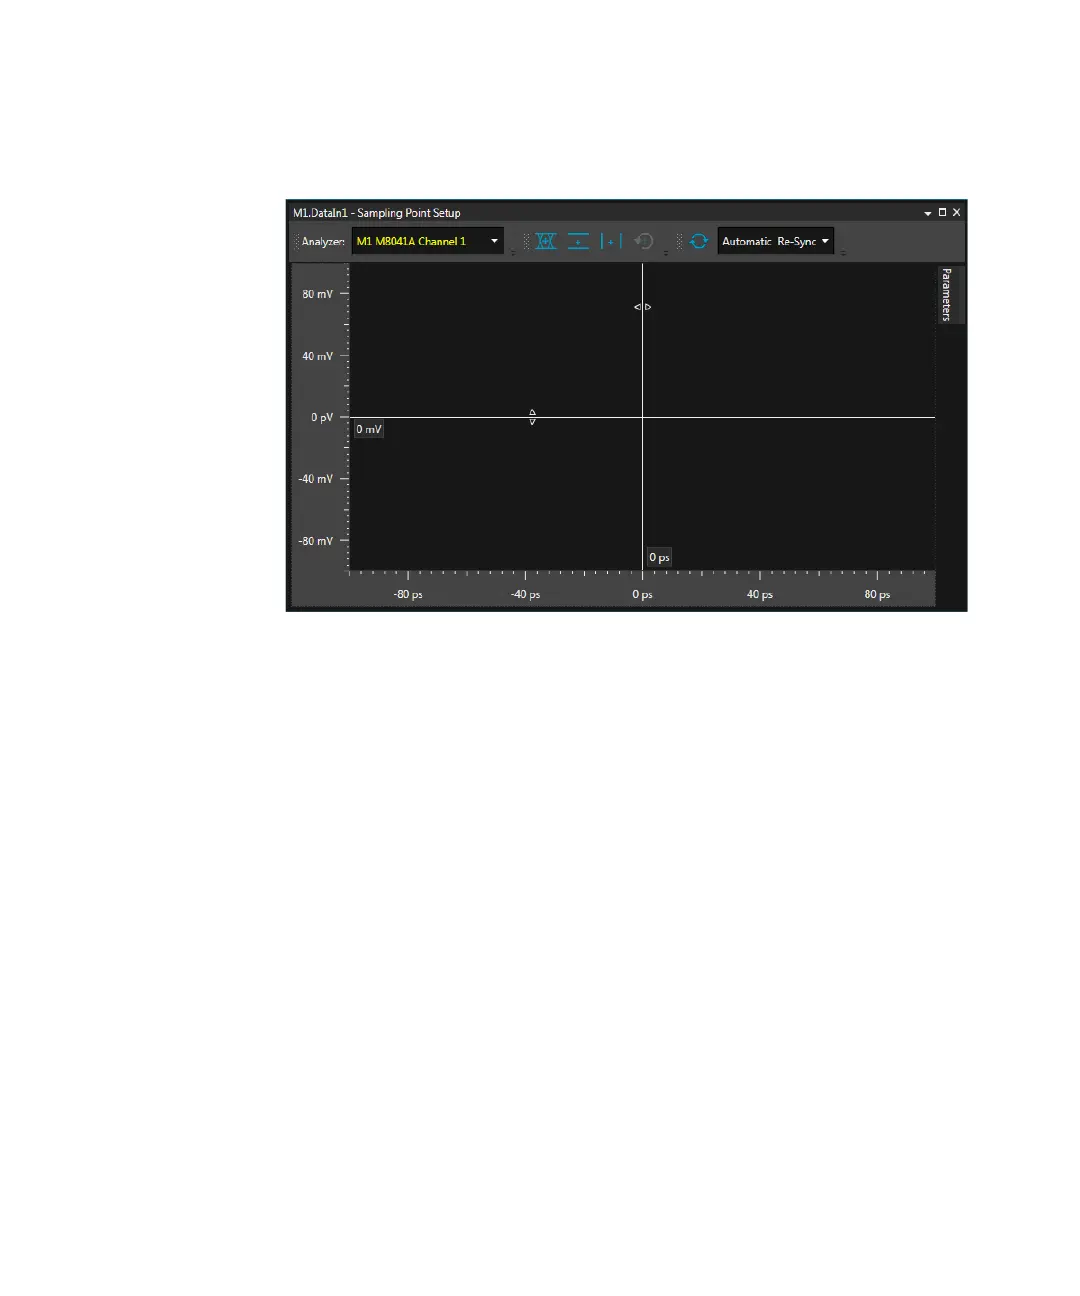
The vertical axis represents the threshold voltage value and the horizontal
axis represents delay which can be used to manually adjusted the location
of sampling point.
For M8040A system (M8045A and M8046A), the Sampling Point Setup
window display histograms which represents number of times a signal has
achieved a particular threshold. For PAM4 line coding, the Sampling Point
Setup window shows three vertical voltage axis which represents Upper,
Middle and Lower threshold value which can be used to manually adjusted
the location of sampling point. For NRZ line coding, the Sampling Point
Setup window shows two vertical voltage axis which represents Upper and
Lower threshold value which can be used to manually adjusted the
location of sampling point.
The following figure shows the Sampling Point Setup window displaying
histograms and vertical voltage axis for PAM4 line coding:
 Loading...