506 Keysight M8000 Series of BER Test Solutions User Guide
8 Working with Measurements
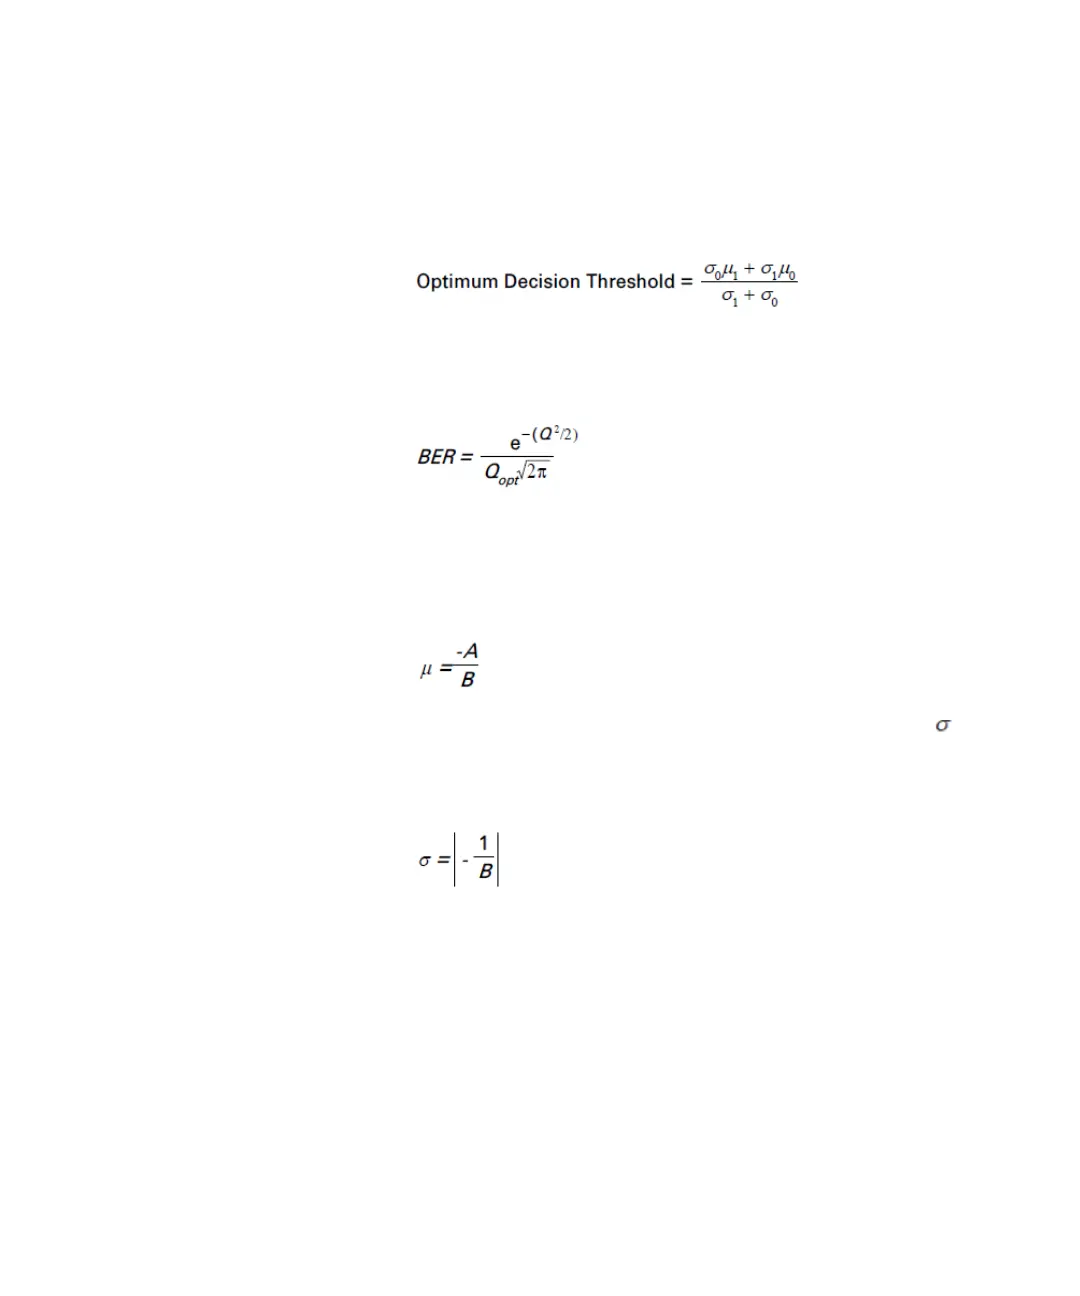
• Q Optimum Threshold: The Q Optimum Decision Threshold is
calculated as:
• Q Residual BER: The Q Residual BER is the expected BER at the
Optimum Decision Threshold. It is calculated as:
Numbers below 1e-255 are expressed as zero.
• Q High Level: The Q High Level is the mean, calculated from the linear
regression curve for the high level data:
• Q High Level Std.Dev: The Q High Level Standard Deviation is the
(Sigma), calculated from the linear regression curve for the high level
data:
• Q High Level Nr. Points: This is the number of data points used for the
calculation of the Q High Level value. It depends on the setting of the
BER Threshold and also on the setting of the Min BER for Q parameter.
The minimum for calculating Q-factor values is two points. It is
recommended to use more than 5 points.
• Q High Level R^2: The R
2
parameter is an indicator that shows how
well the converted data points fit to the straight line. It is calculated as:

 Loading...