Keysight M8000 Series of BER Test Solutions User Guide 507
Working with Measurements 8
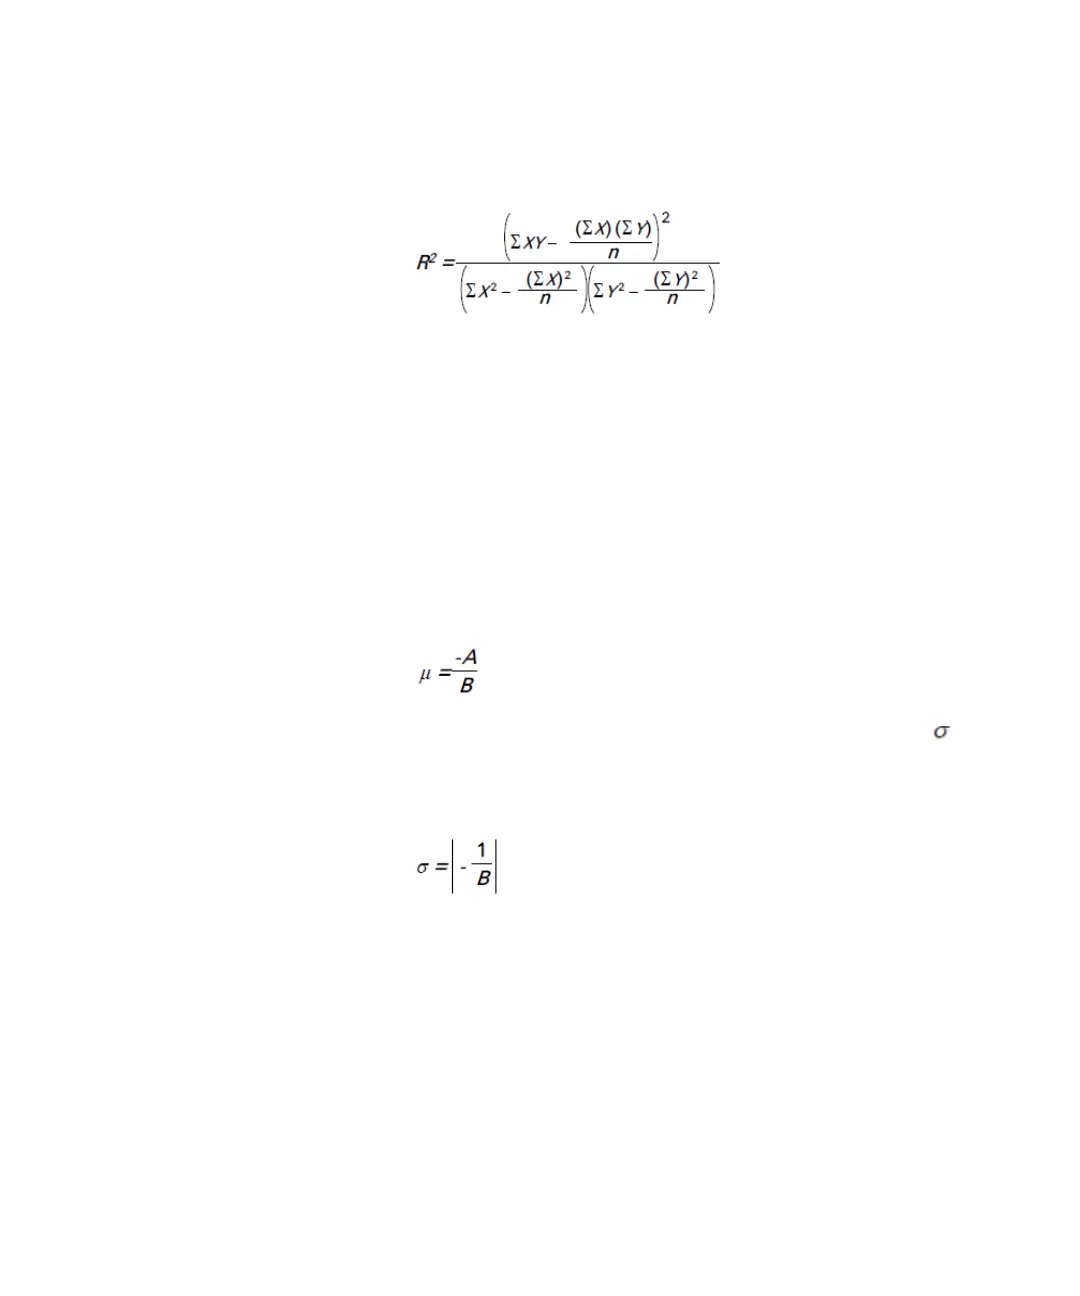
The R
2
parameter should be examined before trusting the Q-values. Its
maximum value is 1.0. It must be seen in conjunction with the number
of data points.
For example: Two data points always fit perfectly well, but the resulting
Q-factor calculations are not reliable. On the other hand, 50 data
points may reveal a poor R
2
value. This tells you that the linearization is
prone to errors.
If the R
2
value falls below 0.75, the Q-factor calculations are not
applicable.
• Q Low Level: The Q Low Level is the mean, calculated from the linear
regression curve for the low level data:
• Q Low Level Std.Dev: The Q Low Level Standard Deviation is the
(Sigma), calculated from the linear regression curve for the low level
data:
• Q Low Level Nr. Points: This is the number of data points used for the
calculation of the Q Low Level value. It depends on the setting of the
BER Threshold and also on the setting of the Min BER for Q parameter.
The minimum for calculating Q-factor values is two points. It is
recommended to include more than 5 points.
• Q Low Level R^2: The R
2
value can also be seen as an indicator of how
well the noise distribution fits to Gaussian shape. It will not fit, for
example, if the received signal is dominated by cross-talk or modal
noise.

 Loading...
