Menu Tables
474
FQ2-S/CH User’s Manual
Run Mode
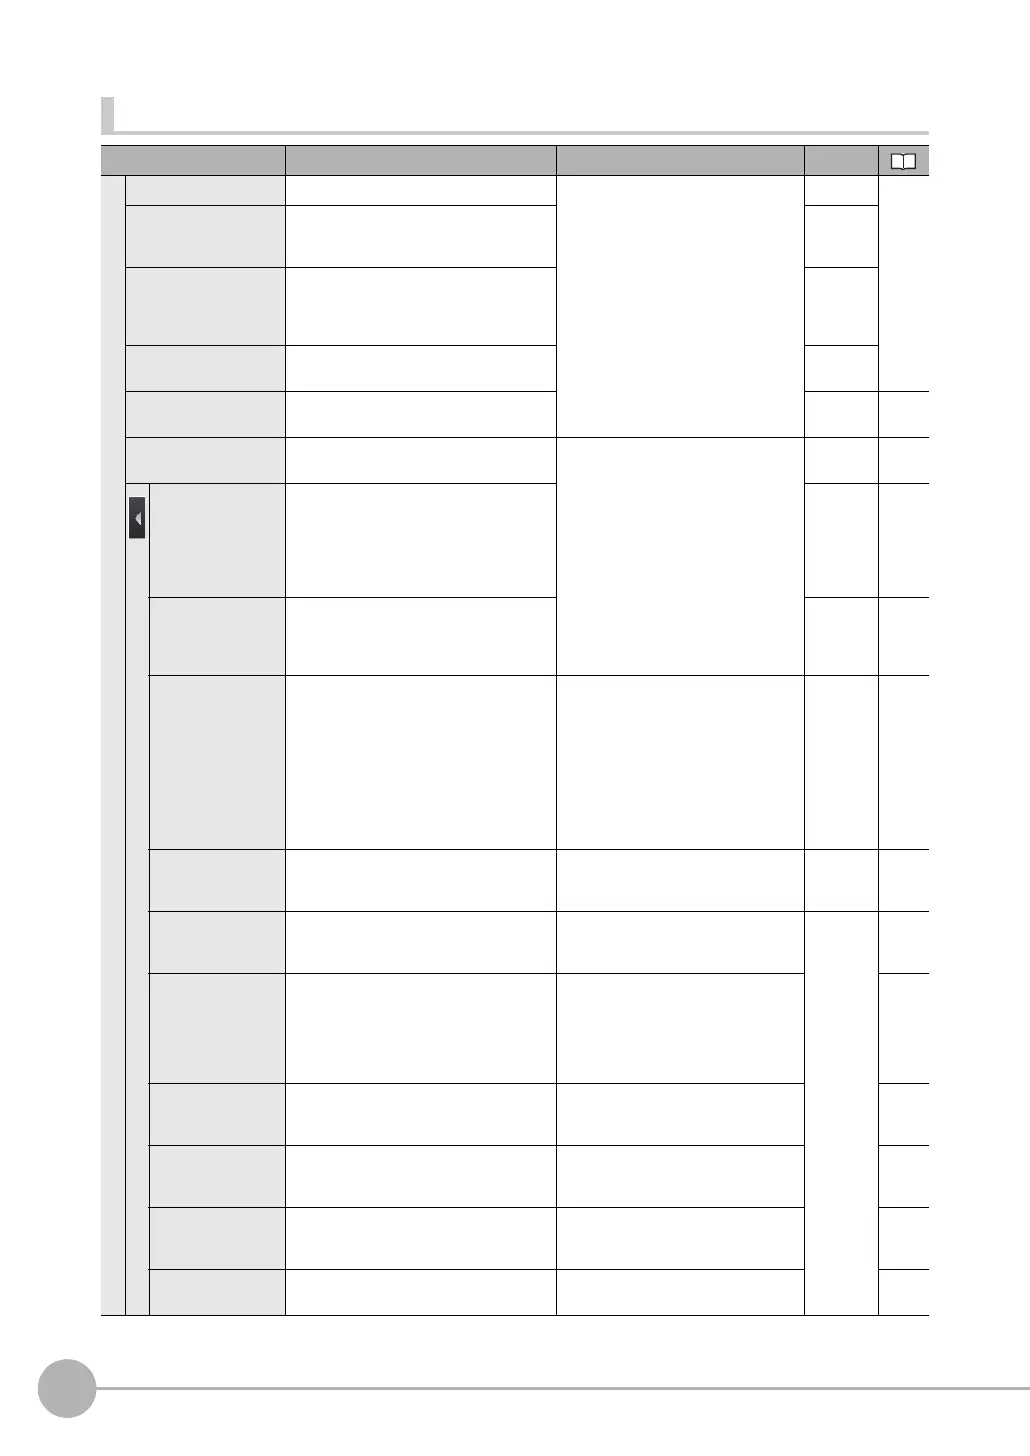
Menu command Description Setting range Data
Select display
Graphic Displays the input image.
---
---
p. 354
Graphics + Details
Displays the inspection item individual
judgement results and measurement val-
ues.
---
Statistical data Displays the total number of measure-
ments and the total number of NG overall
judgements and the NG ratio from when
the power supply was turned ON.
---
All results/Region Displays the inspection item individual
judgement results for all inspection items. ---
Trend Monitor Displays the individual judgement results
saved in the Sensor in a trend monitor.
--- p. 358
Histogram Displays the individual judgement results
saved in the Sensor in a histogram.
---
---
--- p. 360
Model region
(Search, Shape Search
IIl, Search, Shape
Search II, and Sensi-
tive Search only in
[Adjustment mode in
Run] to [ON])
Changes to Setup Mode to adjust the
model region set for each inspection item.
--- ---
Insp. region
(Only in [Adjust-
ment mode in Run]
to [ON])
Changes to Setup Mode to adjust the
inspection region set for each inspection
item.
---
Select display image
(Area and Labeling
only)
Changes the display method of the
extracted color.
・For Area and Labeling
・Measurement image (Default)
・Color extraction image
・Binary image after extraction
・For Area and Labeling
・Measurement image (Default)
・ImageMeas. Img.+Targ. Mdl.
・Edge Image
・Edge Image+Targ. Mdl.
---
Adjust judgement
(Except for statistical
data)
Adjusts judgement parameters without
stopping measurements. --- --- p. 362
Auto display (trend
monitor and histo-
gram only)
Automatically sets the display range
according to the measurement results.
OFF
ON (Default)
Touch
Finder
data
p. 359
p. 361
Display range (trend
monitor and histo-
gram only)
Changes the display range of measure-
ment values.
Measurement value: −999,999,999 to
999,999,999
(Defaults: Lower limit: 0
Upper limit: 100)
class: 5 to 100 (Default: 10)
(Histograms only)
p. 359
p. 361
Number of data
(trend monitor only)
Changes the number of displayed mea-
surement values.
200
400
1000 (Default: 200)
p. 359
Number of data (his-
togram only)
Changes the number of displayed mea-
surement values (i.e., the vertical display
range of the histogram).
5 to 1,000 p. 361
Clear results
(graphic or graphic +
details list)
Clears the measurement results of the
inspection items. --- ---
Delete stats (total
data)
Clears the Statistical data. --- ---
 Loading...
