Spectrum analysis
R&S
®
RTP
419User Manual 1337.9952.02 ─ 12
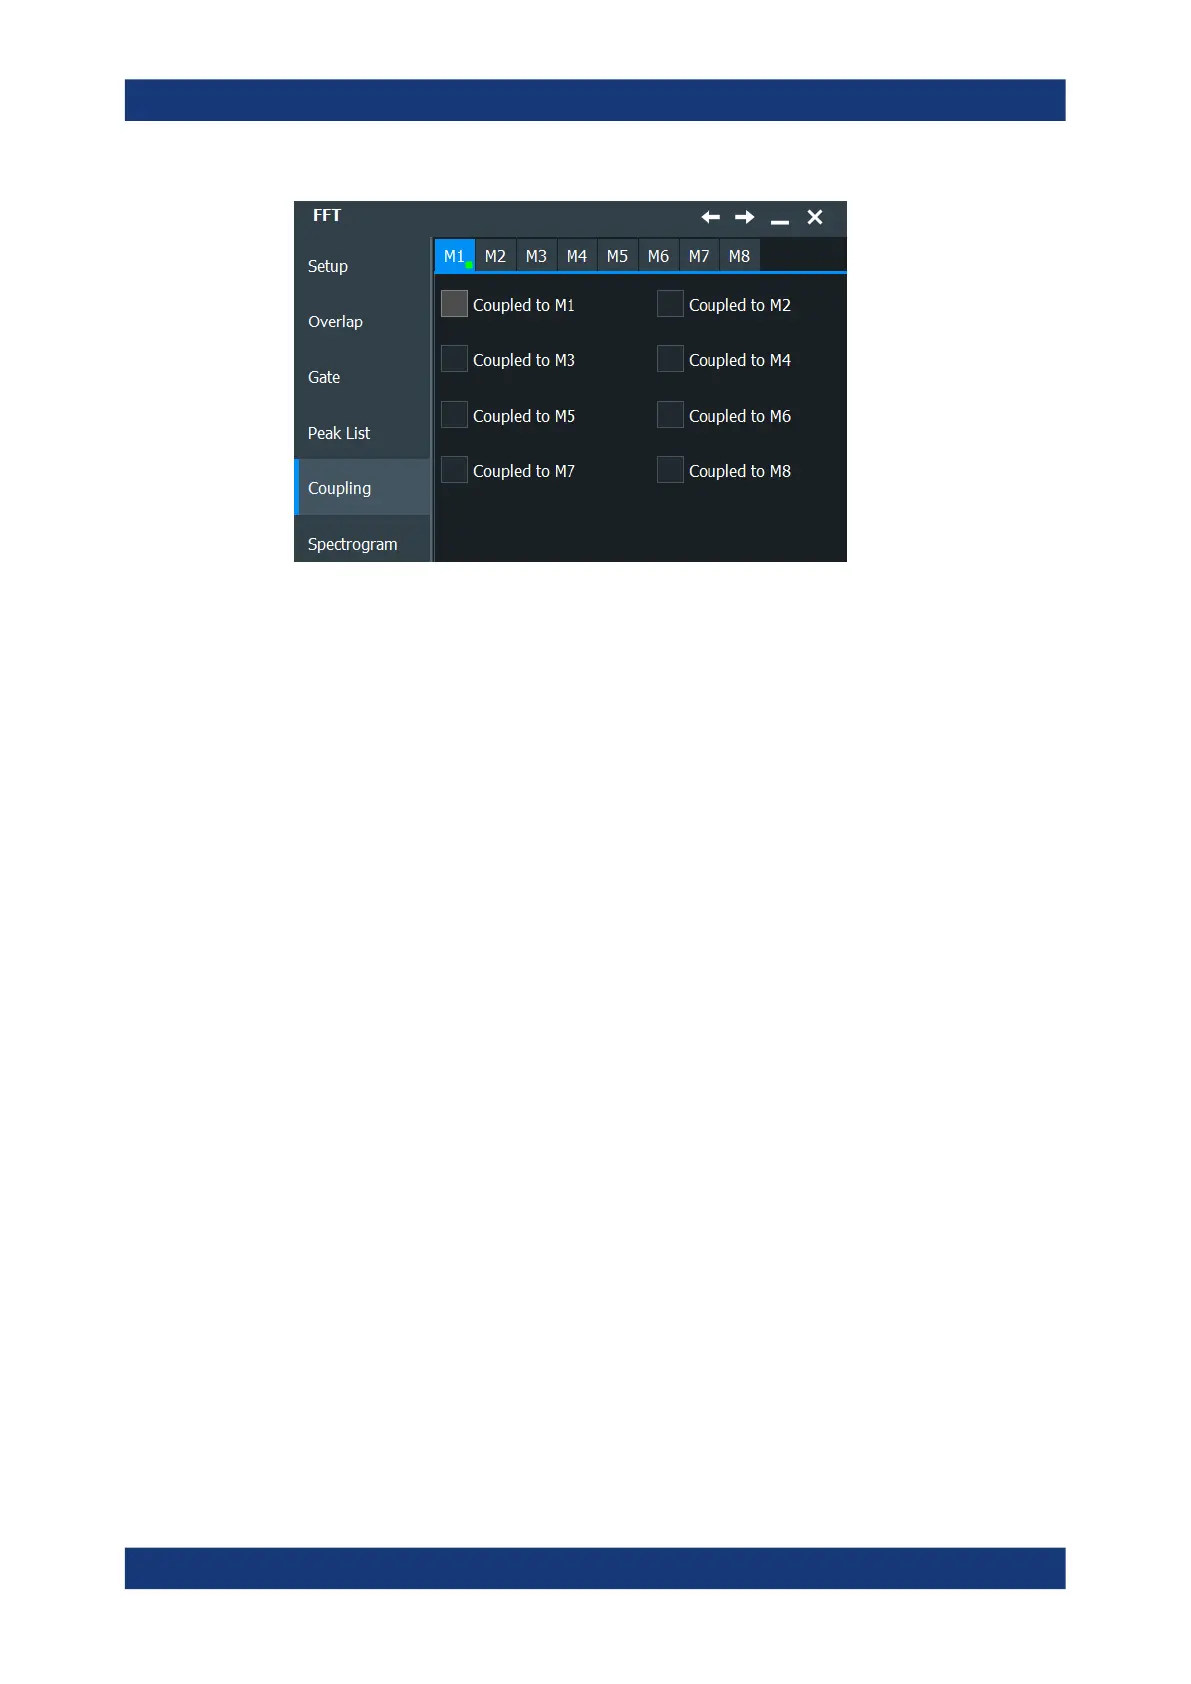
Coupled to M1...M8
Copies the current FFT settings of the selected math waveform (M1...M8) to the other
selected math waveforms, and couples those waveforms. Thus, if any FFT setting for
any of the coupled spectrums are changed, they are changed for all coupled spec-
trums.
Two different sets of spectrums can be coupled at the same time, for instance "M1" can
be coupled to "M2", while "M3" is coupled to "M4".
Note that the formula of the coupled math waveforms is not changed. If necessary, you
must select an FFT function for the math waveform manually before the FFT settings
of the coupled waveform are applied. See Chapter 7.3.1, "Displaying math wave-
forms", on page 290.
Remote command:
CALCulate:MATH<m>:FFT:COUPled:WITH<1..8> on page 1455
9.2 Spectrum analysis (option R&S RTP-K37)
This chapter describes the Spectrum analysis option R&S RTP-K37.
9.2.1 Spectrogram display
The Spectrum analysis option provides a new diagram for spectrum waveforms: a
spectrogram. When you enable a spectrogram, three windows are displayed: the
power vs. time diagram at the top, the spectrogram in the middle (labeled "SG") and
the power vs. frequency (=spectrum) diagram at the bottom.
Spectrum analysis (option R&S
RTP-K37)

 Loading...


