Measurements
R&S
®
RTP
336User Manual 1337.9952.02 ─ 12
"Minimum"
Measurements are performed on the lower envelope.
Remote command:
MEASurement<m>:ENVSelect on page 1373
Statistics
Enables the calculation and display of statistical results.
Remote command:
MEASurement<m>:STATistics[:ENABle] on page 1410
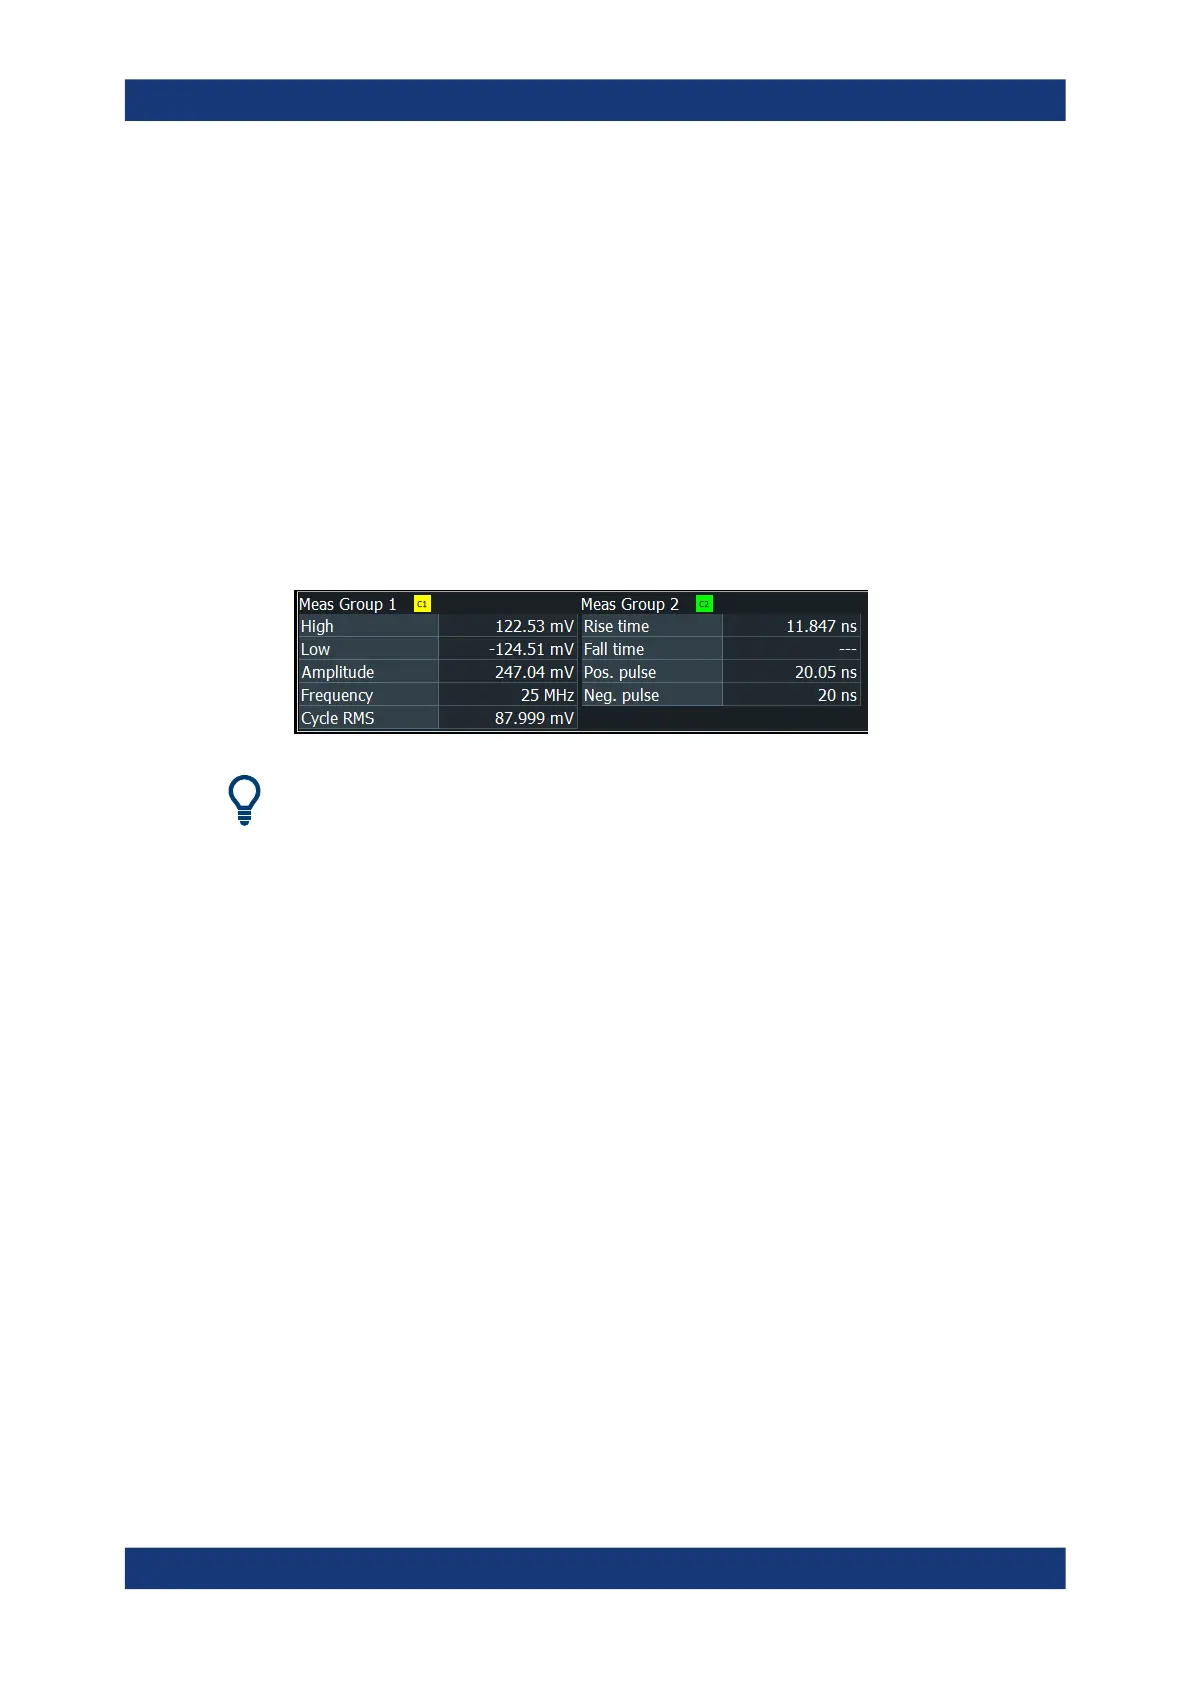
8.2.2 Measurement results
By default, the results of automatic measurements are displayed below the waveform
diagram when an automatic measurement is enabled.
If you want to save space in the display, drag the results to the signal bar. The most
important results are displayed and updated in a results icon.
The function "Clear all" in the "Display" menu resets all results including long-term
measurement and statistic results, and also deletes all waveforms and the history.
Which results are displayed depends on the selected measurements and is described
in detail in the following chapters.
The following additional results are available:
●
Statistics
You can enable statistical evaluation of the measurement results, and select the
statistical results that you want to see. Statistic information is provided in the result
box. Stopping and restarting the acquisition does not reset statistics but only stops
and continues them.
See Chapter 8.2.11, "Result analysis", on page 387
●
Measurement histograms
The results of measurements can be displayed in a histogram which shows the
density distribution of the measurement results in a graphic and thus illustrates the
statistics of the measurements.
See Chapter 8.2.8, "Histograms and histogram measurements", on page 374
●
Long-term measurements
Long-term measurements show the behavior of measurement results over a longer
time or for many samples. You can define the number of long-term points and
export the long-term data, including statistical results. The measurement histogram
is a vertical histogram shown in the long-term diagram.
Automatic measurements

 Loading...


