9 - 8
IPN 074-397-P1G
HAPSITE Smart Operating Manual
Label the Peaks . . . . . . . . . . . . . . . . . . Labels identified peaks with retention
time and area.
Change Search Parameters. . . . . . . . . Displays the peak search
parameters, enables modification of
the parameters.
Previous Search Results . . . . . . . . . . . View results from a previous search.
(Drop down menu of previously
opened data files.)
TIC Graph . . . . . . . . . . . . . . . . . . . . When checked, displays TIC window.
RIC Graph . . . . . . . . . . . . . . . . . . . . When checked, displays the RIC window.
Scan ### . . . . . . . . . . . . . . . . . . . . . When checked, displays current
Spectrum/Scan window.
Control Panel . . . . . . . . . . . . . . . . . When checked, displays the Control Panel.
Properties . . . . . . . . . . . . . . . . . . . . Allows access to the properties of the
display.
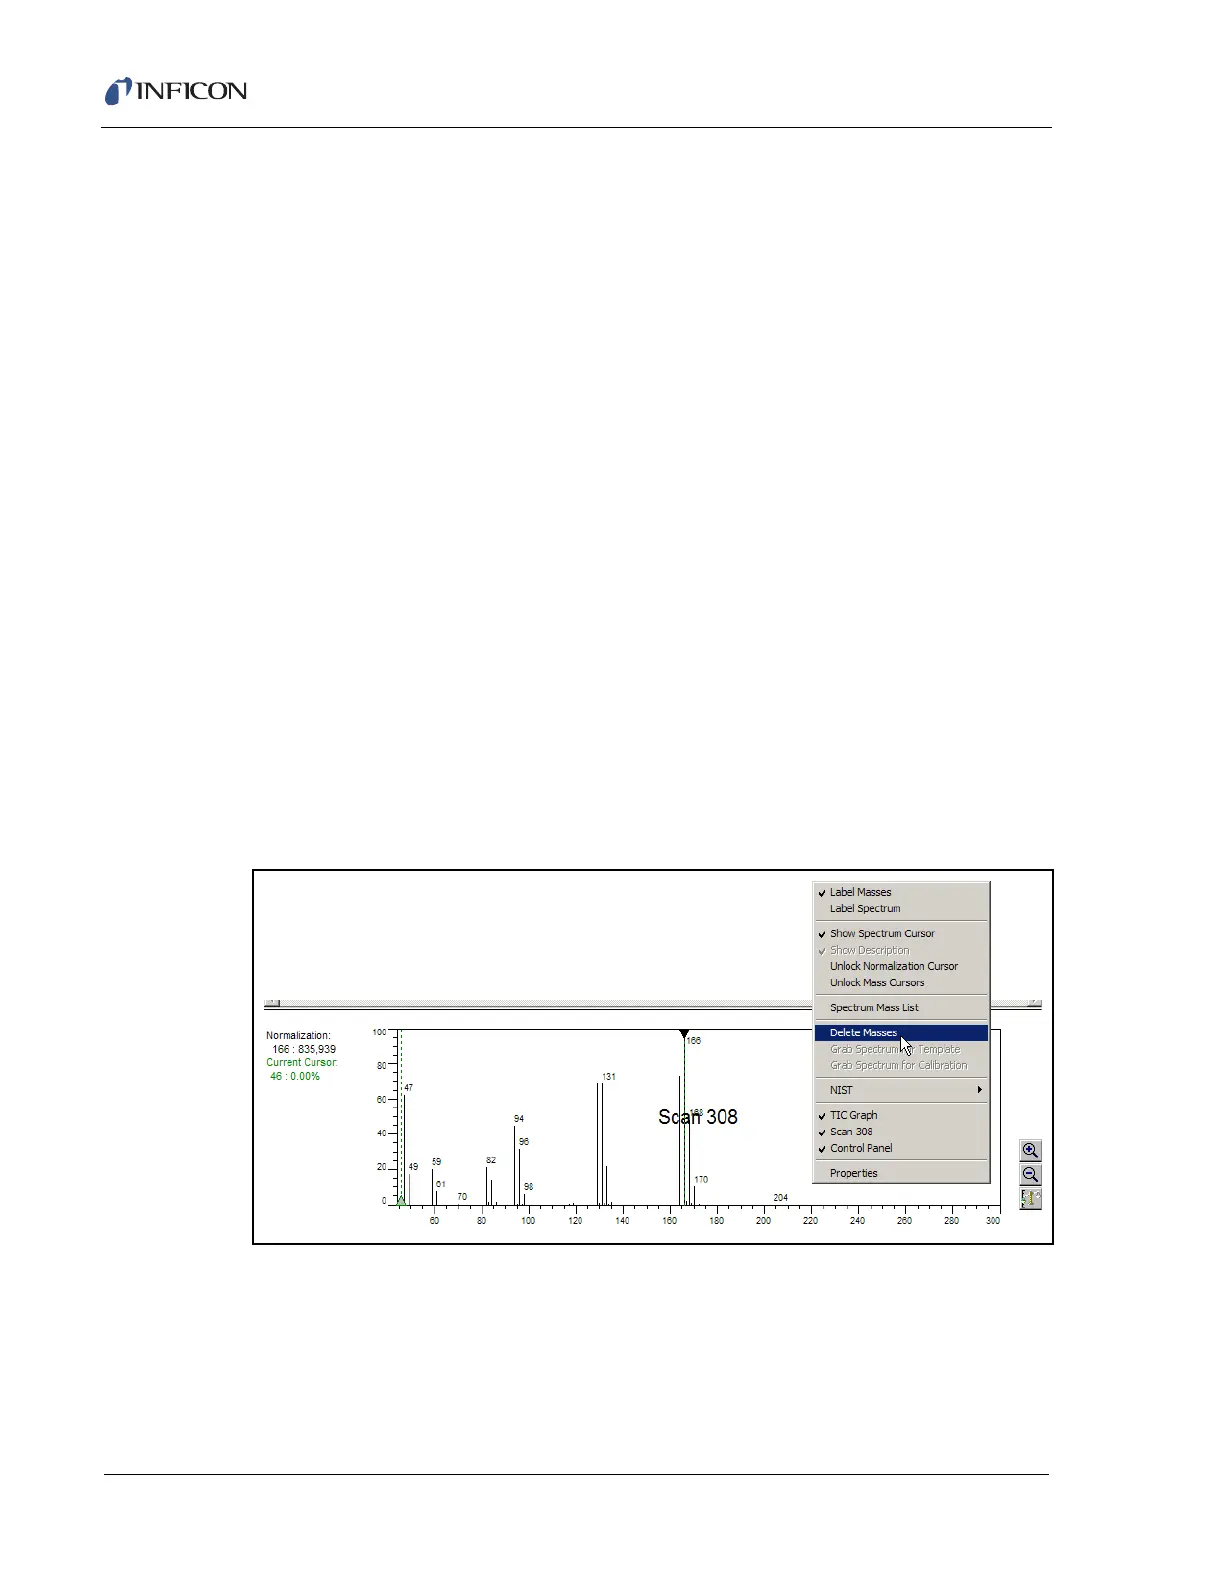
9.4.2 RMB in the Spectrum Display Window
The Spectrum display is shown in the Scan Window. Every time the LMB is double
clicked in the TIC window, a spectrum for that scan is displayed. Clicking the RMB
in the Scan/Spectrum window will access the menu shown in Figure 9-8.
Figure 9-8 Spectrum Display Menu
Label Masses . . . . . . . . . . . . . . . . . When checked, will display the mass
numbers in the Spectrum window.
Label Spectrum . . . . . . . . . . . . . . . Brings up a text box to allow the analyst to
manually label the spectrum in the Spectrum
window.