9 - 16
IPN 074-397-P1G
HAPSITE Smart Operating Manual
9.5.3.2 Additional Features of the Range Tool
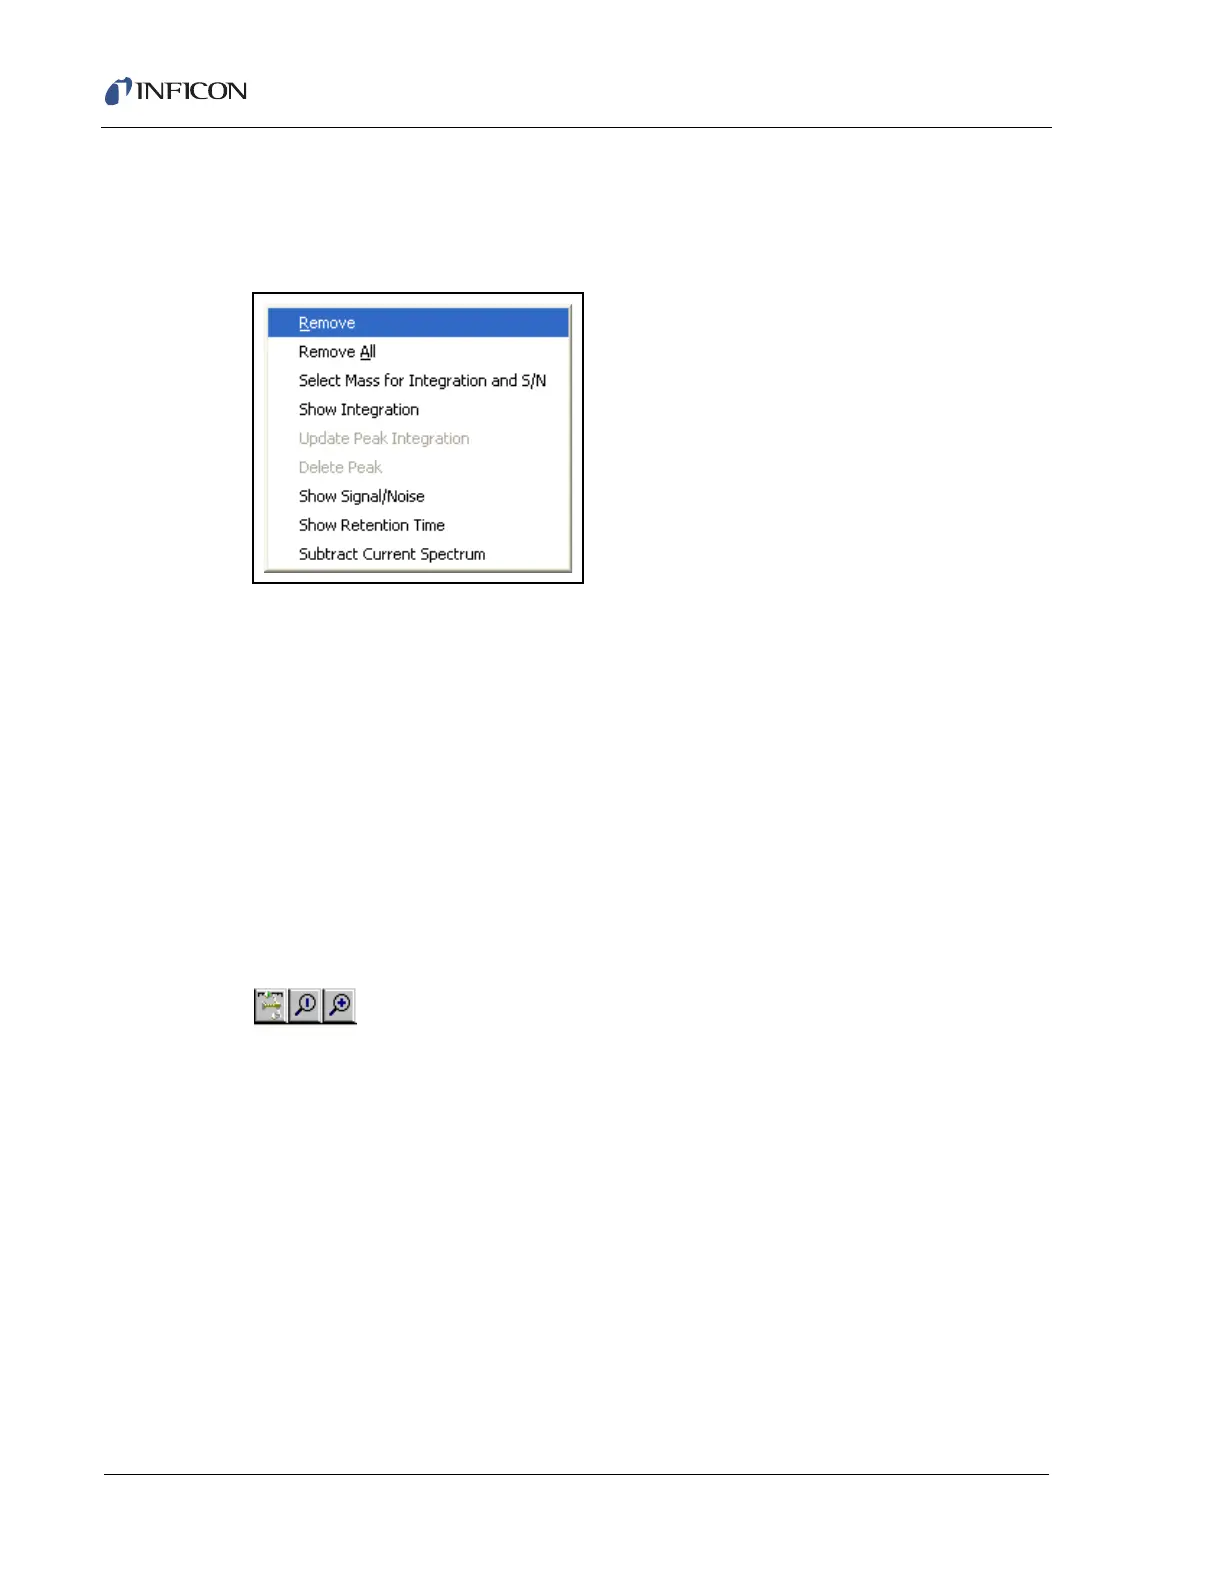
If the cursor is placed over R1, and the RMB is clicked, the following menu items
are available. Refer to
Figure 9-15 Range Tool RMB Menu
Remove . . . . . . . . . . . . . . . . . . . . . . Remove the Range cursor
Select Mass for Integration . . . . . . Select the TIC or RIC for Integration
Show Integration . . . . . . . . . . . . . . Displays the integration on the x-axis
Show Retention Time. . . . . . . . . . . Displays the retention time on the x-axis
Show Signal/Noise . . . . . . . . . . . . . Show Signal to Noise Ratio. A Background
Must be Selected using B1 first.
Subtract Current Spectrum . . . . . . Subtract the current spectrum (Green
Triangle) from the range.
9.6 Using the Zoom Function
The Zoom function allows targeting a particular section of the
chromatogram for a detailed view.
Co-elution of peaks can be detected by zooming in on odd shaped peaks.
9.6.1 Using the Zoom Function in the TIC/RIC Window
There are two ways to Zoom into a TIC/RIC:
1 Move the mouse cursor to the Magnifying glass with the "+" inside. When the
Left Mouse Button (LMB) is clicked, there will appear two vertical lines on the
TIC/RIC graph window. Place the cursor on one of the vertical lines, click and
hold the LMB and drag the vertical line to where zooming may begin. Repeat
the actions of the previous sentence for the second vertical line. See Figure