12 - 10
IPN 074-397-P1G
HAPSITE Smart Operating Manual
12.4 Display Function
The Display Function displays the selected data file for both Calibration and ID
Unknowns. To review identifications, select chromatographic peaks and spectra
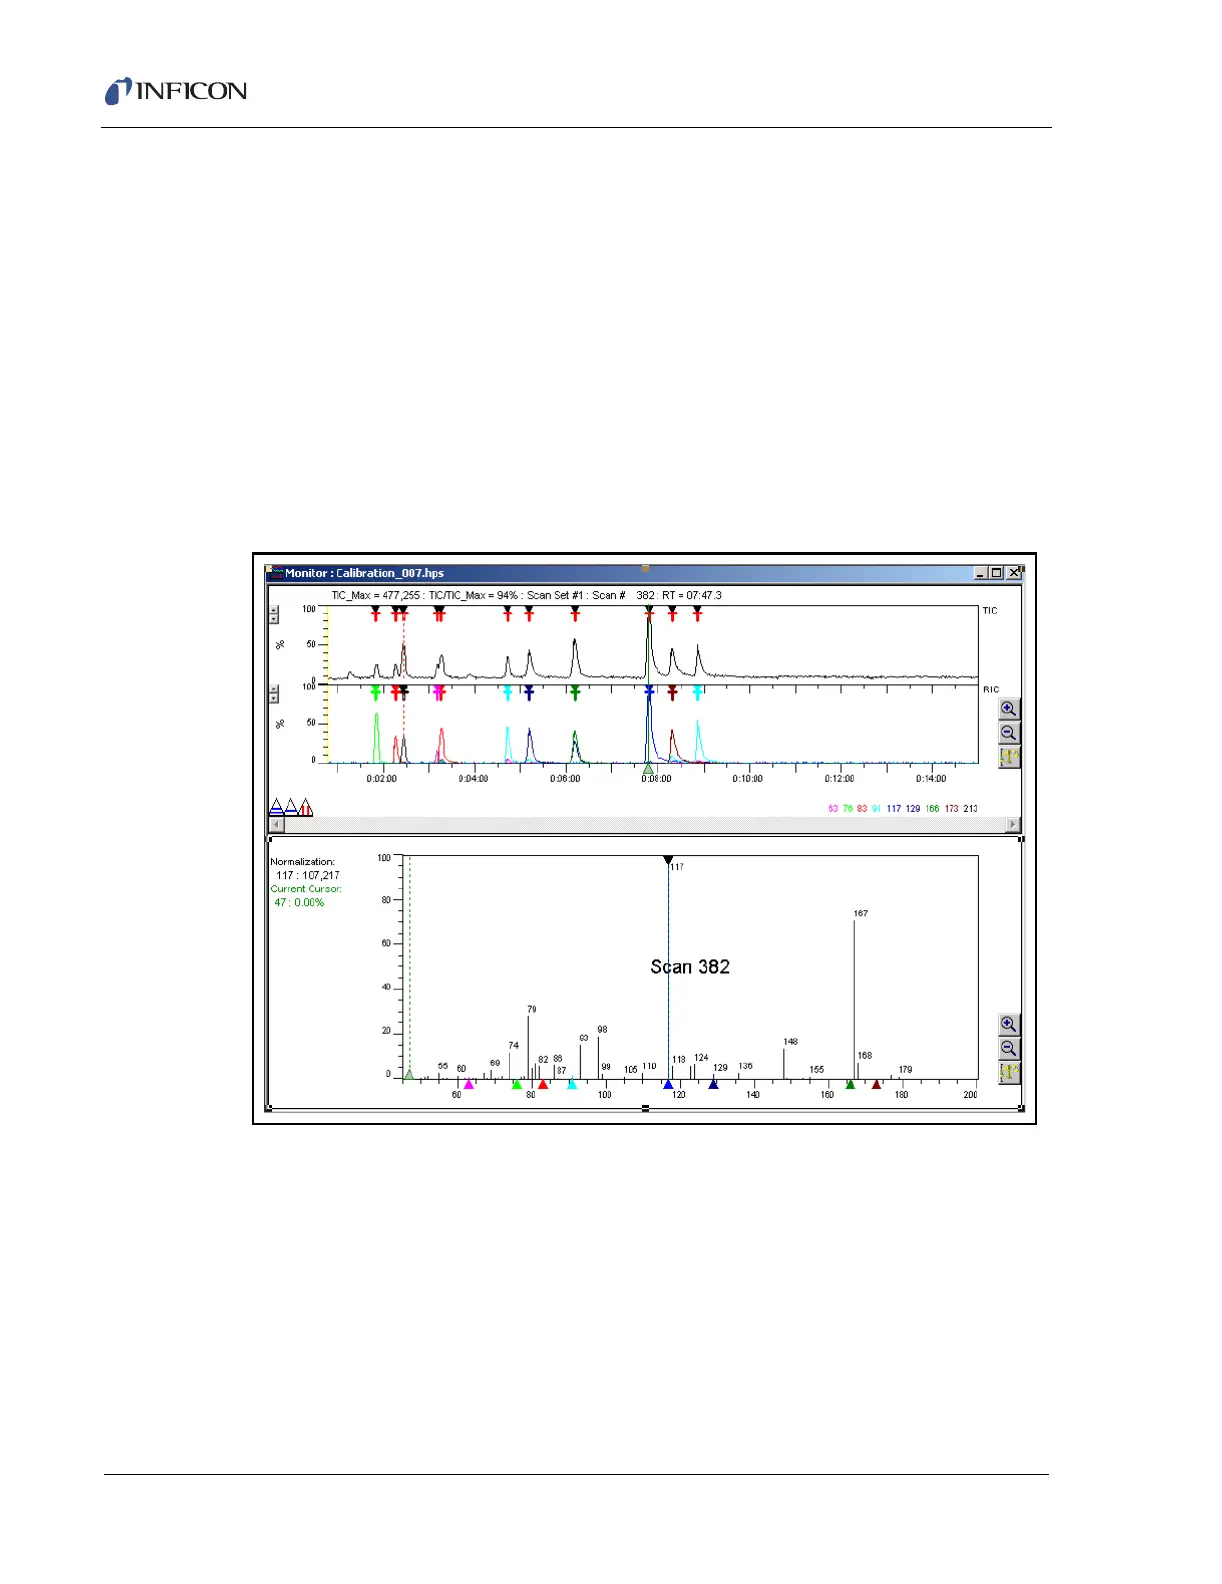
(compounds), add to a library, and manually reintegrate peaks. See Figure 12-7 on
page 12-10
To display a chromatogram from Calibrate or ID Unknowns, select the file by
highlighting with the left mouse button and selecting the Display button.
The controls of the Display function are similar to the data review functions for
working with RICs (Reconstructed Ion Chromatograms) and Mass Spectra. Data
Review is described in Chapter 9, Data Review. Additional features are described
below.
Figure 12-7 Calibration Display
See Figure 12-8. With the Build/Edit Template option selected in the Calibrate
screen, the Display button will show the peaks detected and selected for the library
template when a peak search is performed. Peaks selected for the template are
indicated on the plot with a T. The quant mass for each analyte is displayed on the
RIC plot with the T symbol corresponding in color to the mass as displayed in the
lower right corner of the RIC graph. If a peak has not been detected, the mass
spectrum of that peak can be manually selected to add the compound to the library