9 - 21
IPN 074-397-P1G
HAPSITE Smart Operating Manual
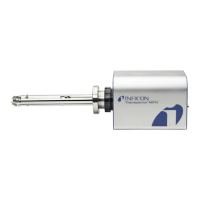
3 Enter the name of the compound, to be located, in the box on the top left of the
screen. EXAMPLE: Benzene. See Figure 9-23.
Figure 9-23 NIST Name Entry
4 The spectrum and information about the compound will appear in the two boxes
to the right of the names column.
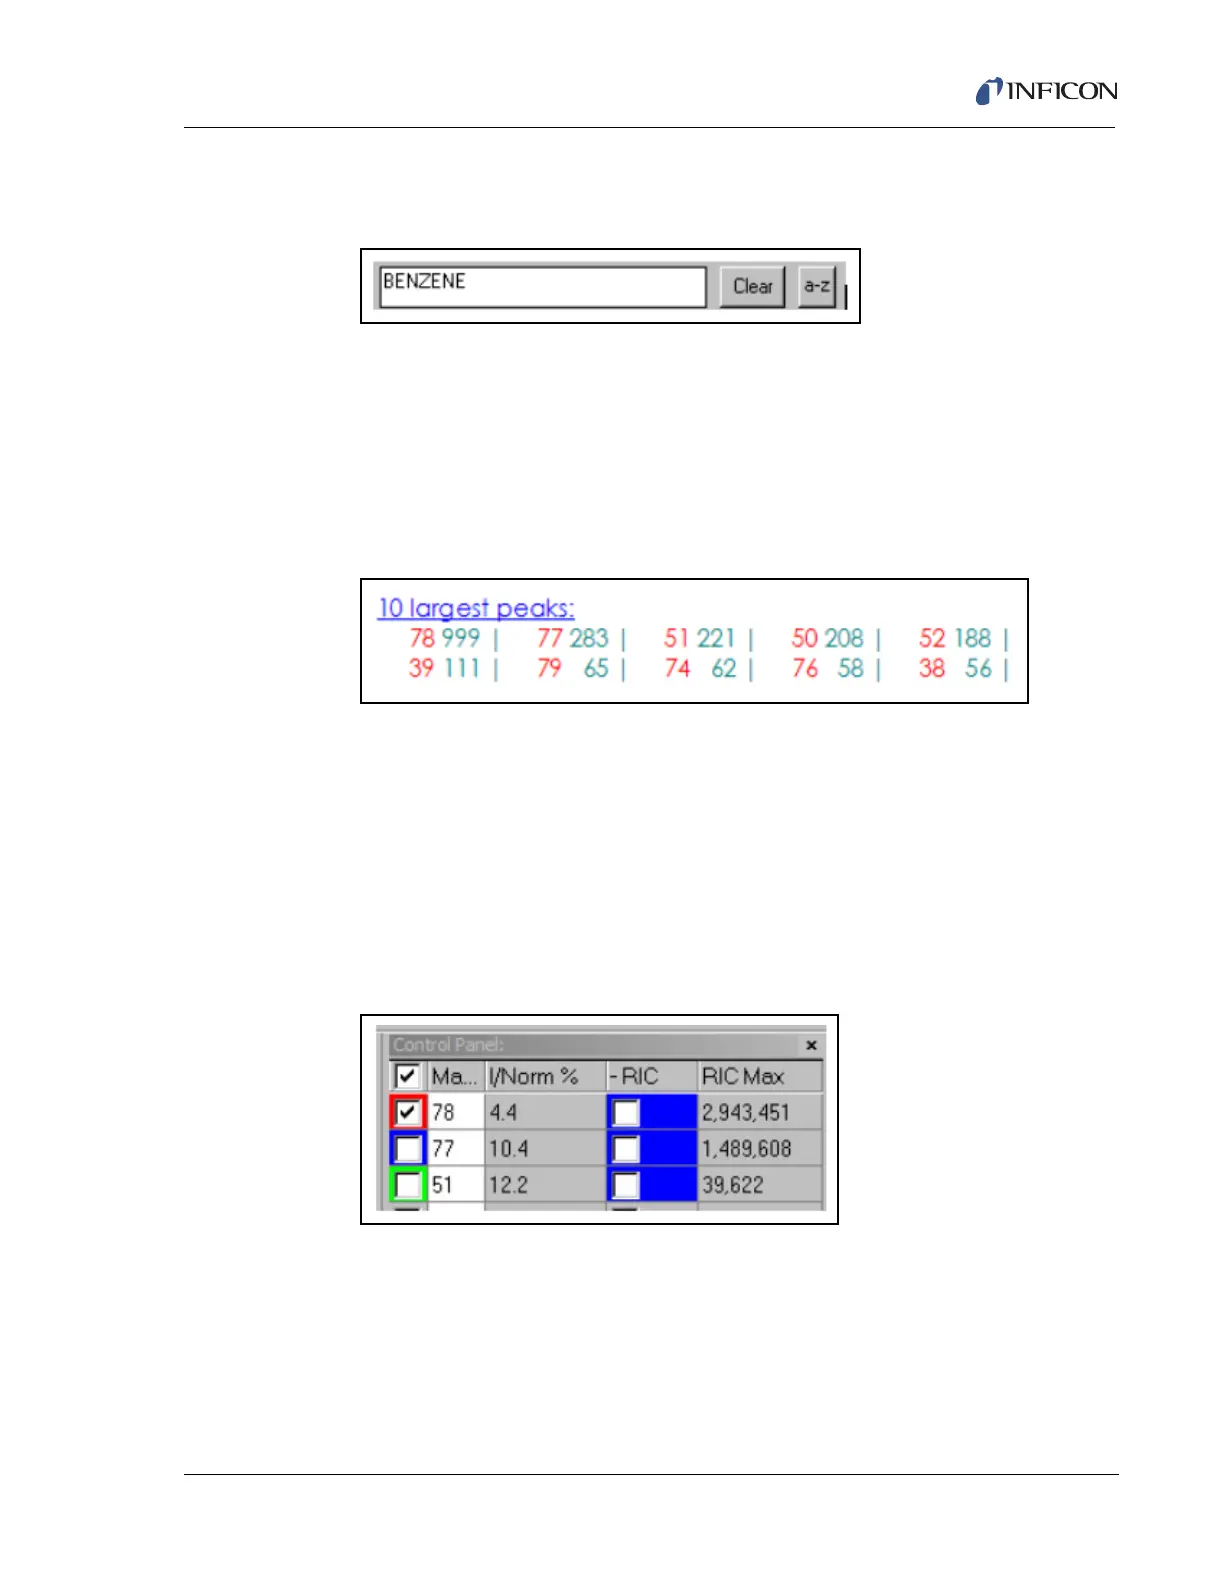
5 In the bottom right box, the 10 Largest Peaks will be listed. Make a note of the
three largest mass peaks that are between 45-300 AMU.
HINT: Peaks are listed in order from the largest to the smallest. EXAMPLE:
Benzene's 3 largest peaks are masses 78, 77 and 51. See Figure 9-24.
Figure 9-24 Top 10 Masses
6 Minimize the NIST window and return to the Smart IQ Data screen displaying
the TIC chromatogram.
7 Enter the 3 largest peaks, from the compound in step 5, in the control panel
box. Enter each mass number in the boxes under the Ma... (Mass) column. See
Figure 9-20.
8 Check the box to the left of the mass or press ENTER. This will plot the mass
in the RIC window and create a new row in the control panel for an additional
mass to be entered. See Figure 9-25.
Figure 9-25 Entering Masses in Control Panel
9 As soon as the first mass is checked, a RIC plot will open directly under the TIC
plot. See Figure 9-26.
NOTE: This RIC window can be closed by un-checking the masses selected in the
control panel.