12 - 15
IPN 074-397-P1G
HAPSITE Smart Operating Manual
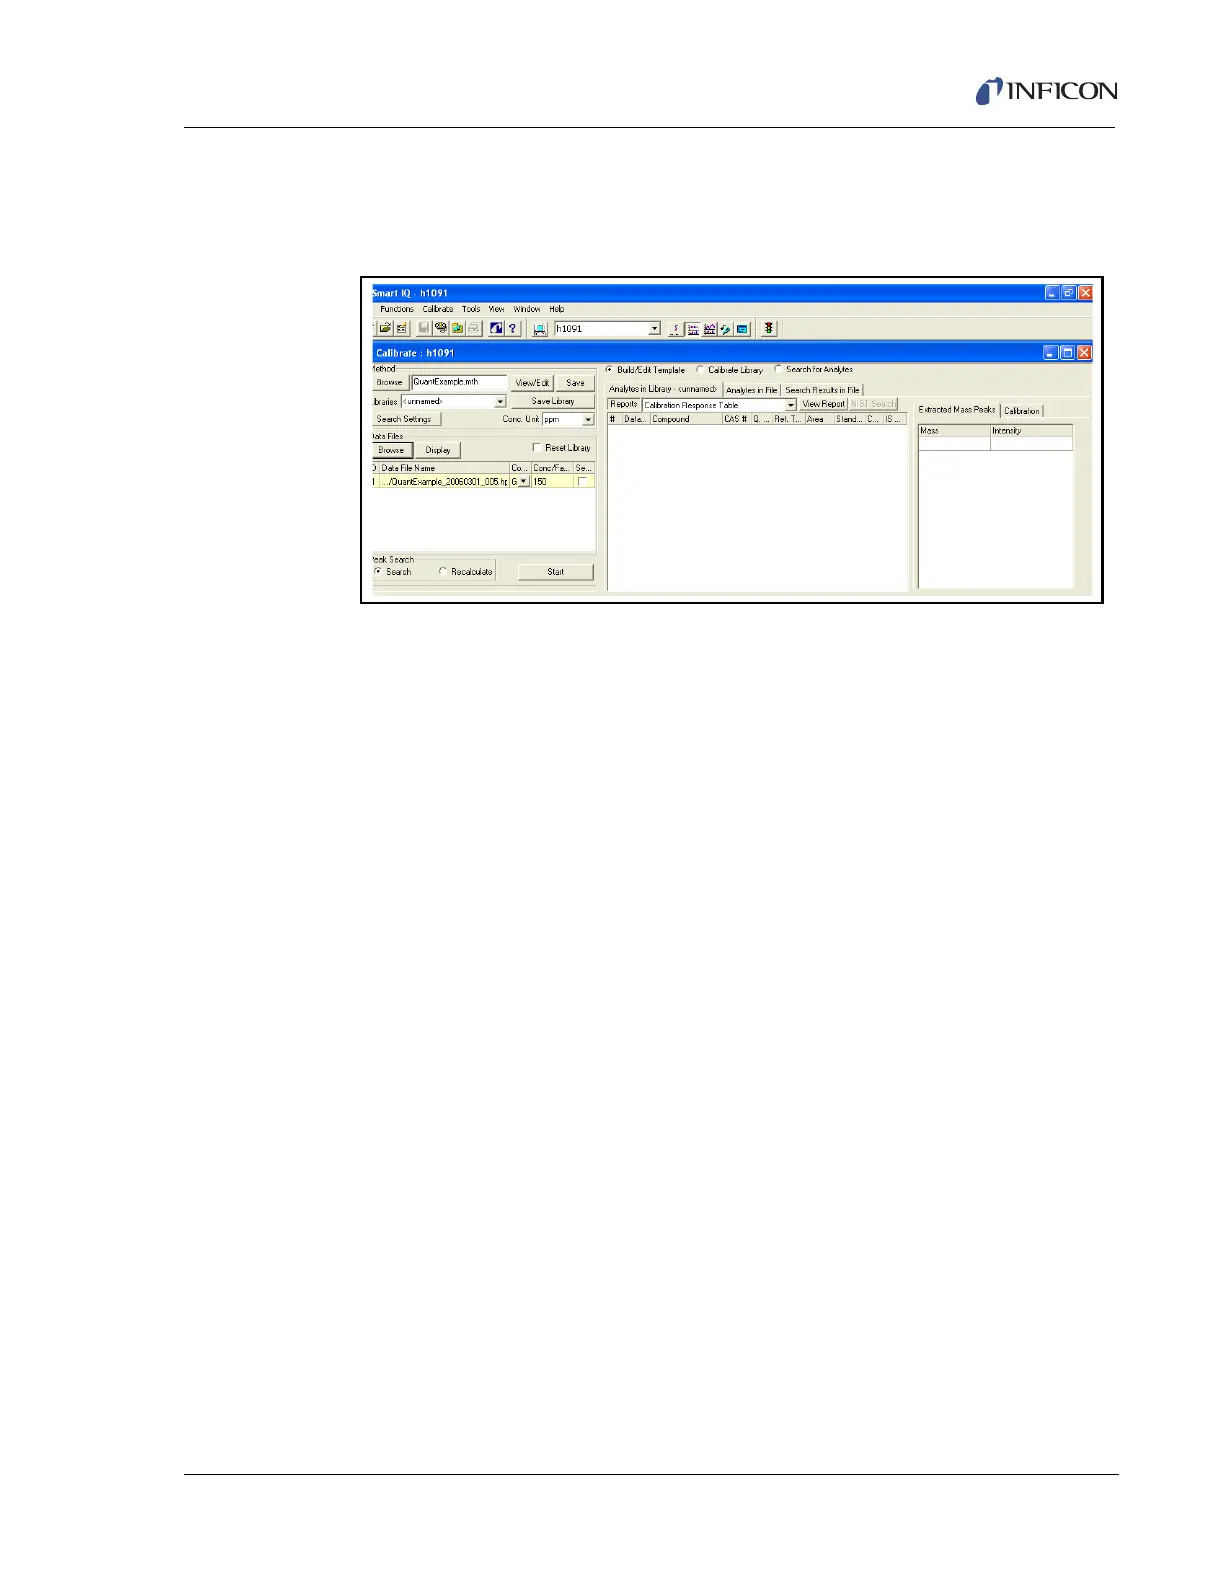
4 Use the Browse button under Data Files to select the data file to be used to
create the library template. This should be a data file (or files) collected when
running known samples. See Figure 12-13.
Figure 12-13 Calibration Control Panel with Data File Selected
NOTE: Best practice is to use a high or mid range standard and not the lowest
concentration level for calibration library development. Low concentration
standards will not provide full spectra.
HINT: Step 5 and Step 6 will be automatically completed if the information was
entered in the Data File Information screen when the sample was run.
5 Enter or select the concentration units.
6 Select the Concentration field and enter the concentration of the standard.
The Concentration reference should be set to Global.
7 Check the selection box.
8 Make sure the Build/Edit Template button is selected and then select Start.
The data file will be processed and the detected compounds displayed. Peaks
are detected according to the Search Settings. The library template will be
filled in with the detected peaks. The compounds identified by AMDIS will have
Compound names and CAS#’s. See Figure 12-14. The Chromatogram display
window will automatically open below the calibration control panel to display the
plot and the detected peaks.
The peaks marked with a T have been identified by AMDIS, and those with only
the black triangle have not been identified. All of the features described in
Chapter 9, Data Review can be used to interact with the plot.