242
26. TREND GRAPH
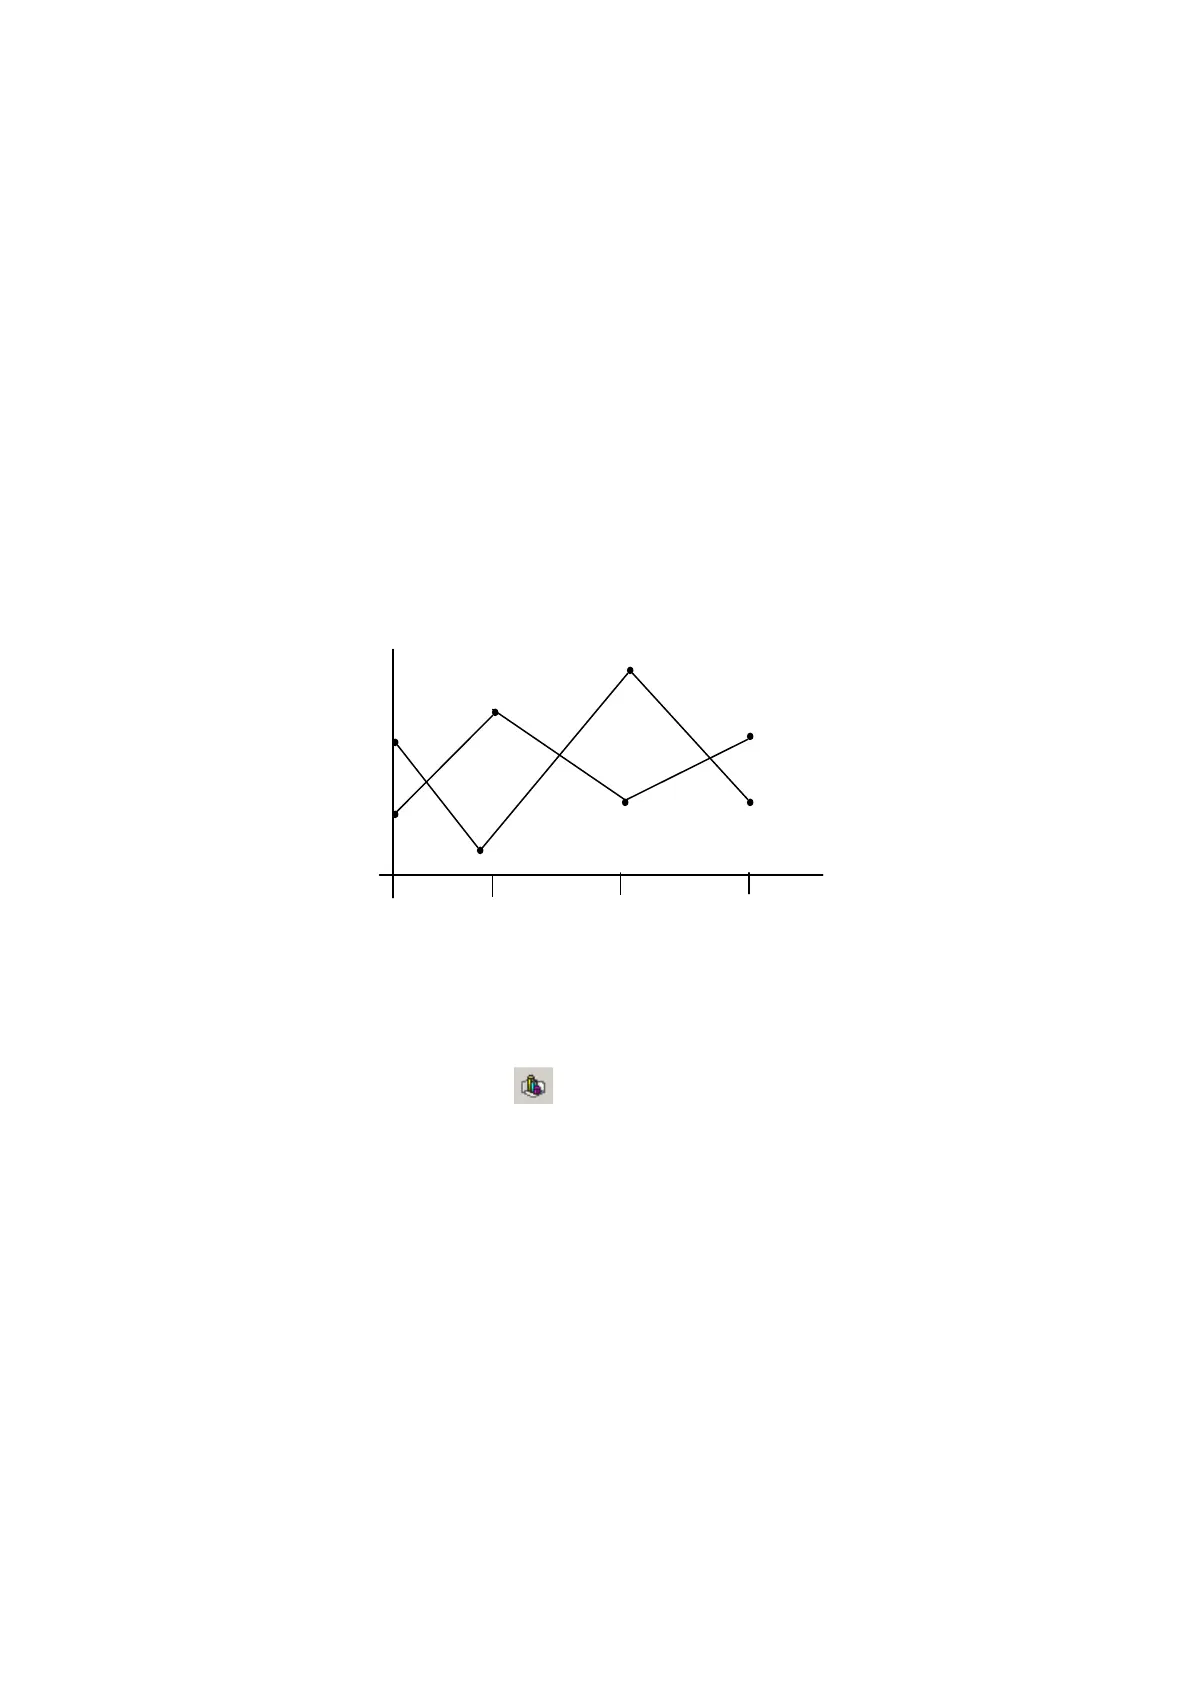
It displays saved value in designated device as line graph for time passing.
26.1 BASIC FUNCTION
• X, Y axis indicates time and device value respectively.
• It is able to designate max/min.value to be displayed on a graph, it does not display point out of the
range.
• It is able to draw max.8 lines with 50 of sample points.
• It is able to configure sampling cycle up to 100ms~3600s with 100ms units.
• It is able to designate direction of graph according to time passing.
• If it is switched into other screen according to configuration, it saves sample data in GP inner
memory and it is able to display old history using this data for screen restore.
26.2 EDIT PROCEDURE OF TREND GRAPH IN EDITOR
(1) Select [Draw]-[Line/Trend/Bar] or in tool bar, then, Line/Trend/Bar property window is
popped up.
(2) Select trend in basic tap.
(3) Designate the number of graph and point in form tap.
(4) Designate monitor device, data type and graph type in monitor device tap.
(5) Designate the value of high limit and low limit of graph in case tap.
(6) Press OK button, line graph tag is created in a screen.
(7) Adjust as proper size.
DEVICE VALUE
D200
D100
1
2
TIME
 Loading...