236
25. LINE GRAPH
It designates more than two devices and displays saved value of device as line graph.
25.1 BASIC FUNCTION
• It is able to draw as max.8 lines having max.50 of device points.
• It is able to designate max/min value displayed on a graph and it does not display point out of the
range.
• It is able to designate to allot from lead device of left to right or right to left on X axis.
• It cannot display specified value according to configuration.
25.2 EDIT PROCEDURE OF LINE GRAPH IN EDITOR
(1) Select [Draw]-[Line/Trend/Bar] in main menu or in toolbar, then, Line/Trend/Bar graph
property window is popped up.
(2) Select line in basic tap.
(3) Designate the number of graph and point in form tap.
(4) Designate monitor device, data type and graph type in monitor device tap.
(5) Designate the value of high limit and low limit of graph in display range tap.
(6) Press OK button, line graph tag is created on a screen.
(7) Adjust as proper size.
※Notice
One line graph is only be arranged in a screen and it is not able to arrange with trend graph in a
screen.
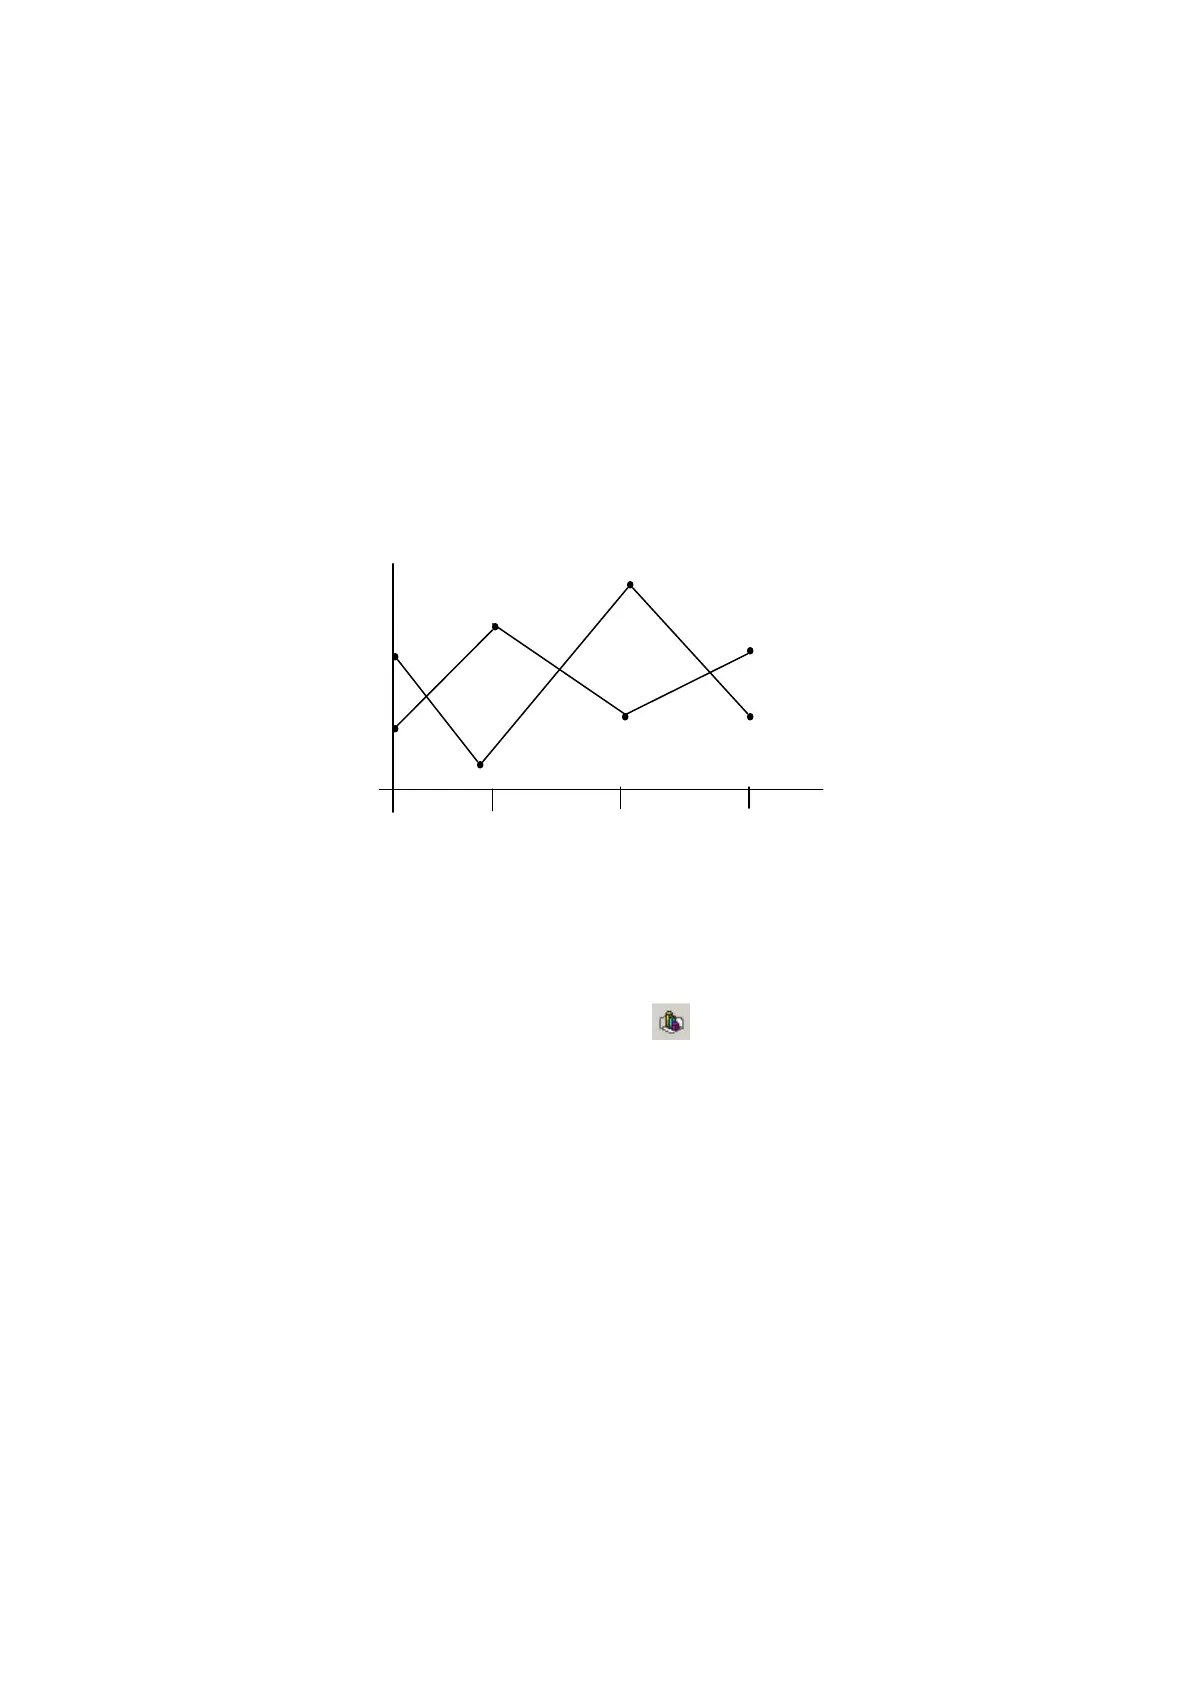
DEVICE VALUE
Graph 2
Graph 1
D100
D101
D102 D103
D105
D106 D107
Device (2~50point)
 Loading...