257
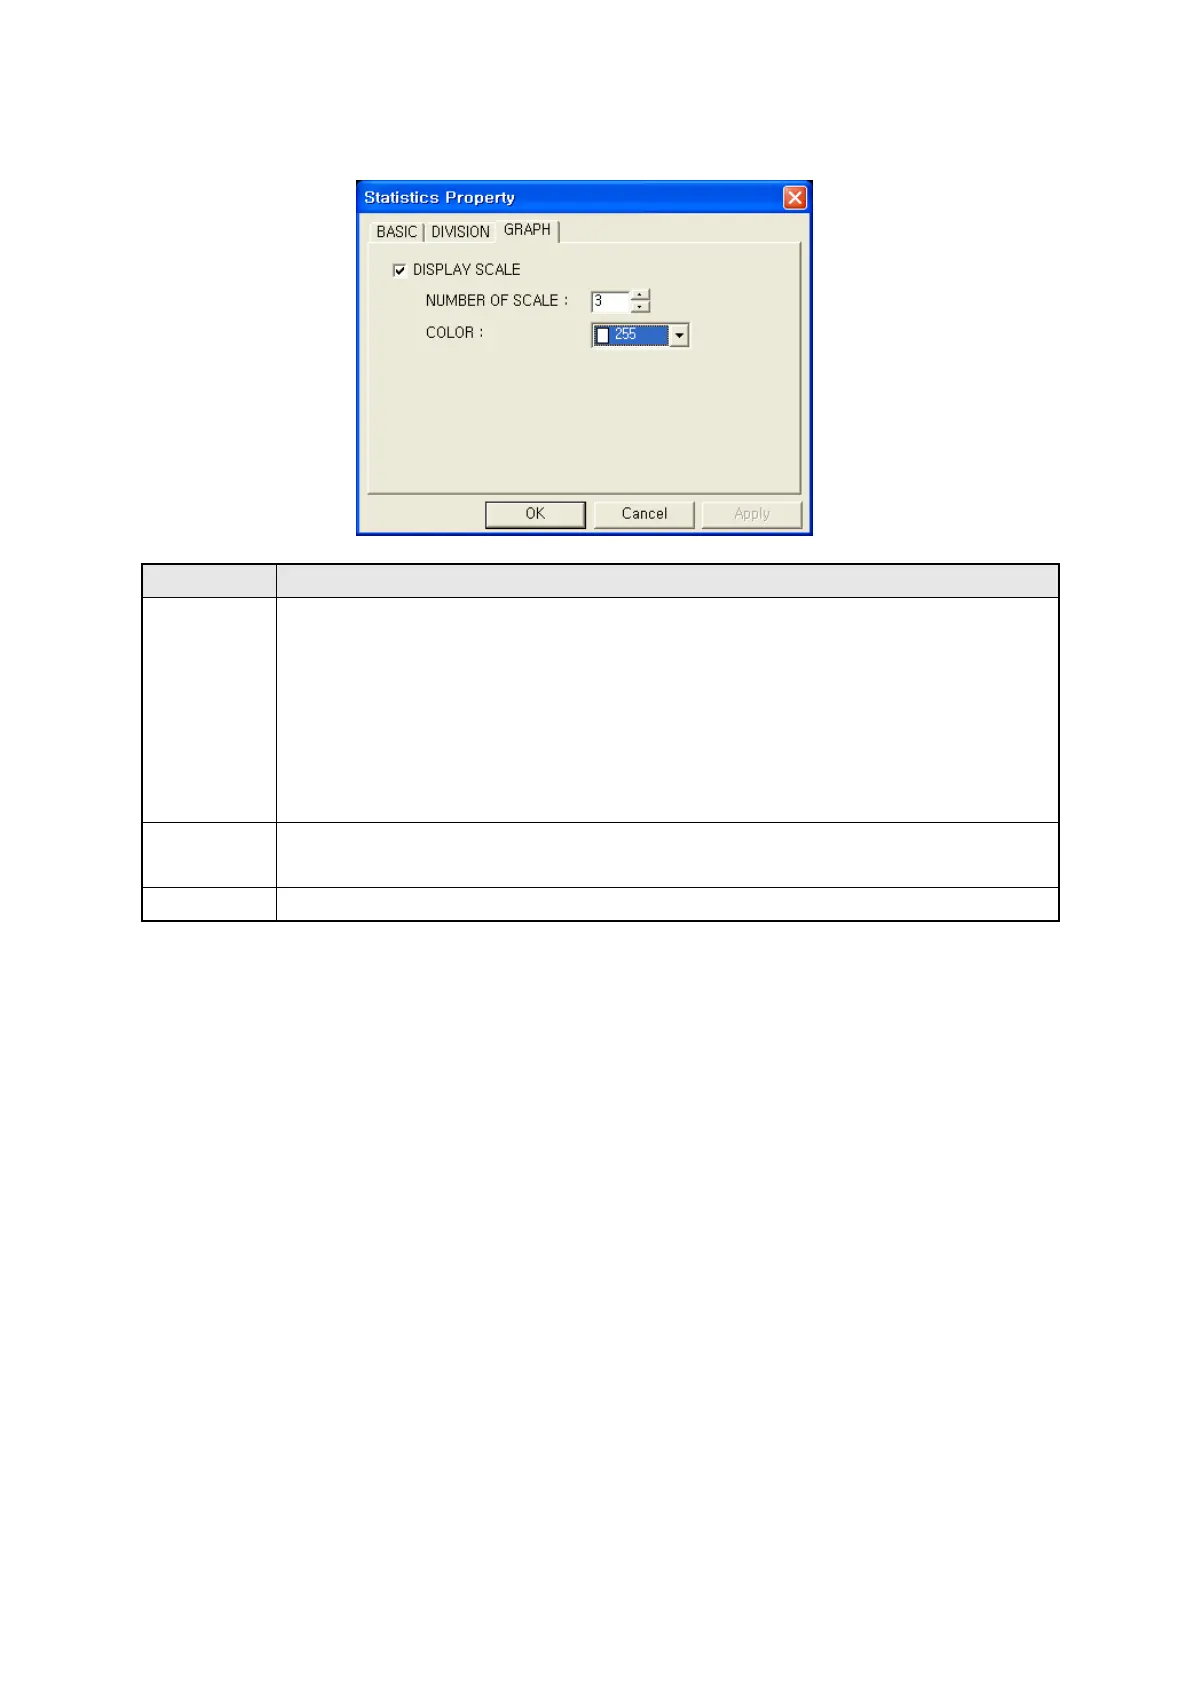
28.3.3 Graph tap
①Scale
display
• Designate to display scale.
• In case of rectangle, the scale is displayed in the bottom of the graph when
direction is right and left for upper of graph.
• It is displayed according to circumference as numbers with regular intervals based
on 12 o’clock.
• In case of rectangle, it is displayed according to left side of rectangle for upper
direction and bottom side of rectangles for right direction.
②Scale
• Designate the number of scales to display.
•
It is able to designate within 2 ~ 50.
③Color
•
Designate outline color of scale and graph.
①
②
③
 Loading...