254
28. STATISTICS GRAPH
It displays more than 2 of value as a percentage. It is able to display with rectangle and circle graph
according to configuration. The whole graph displayed on statistics graph is a sum total of absolute
value from word device configured as parts of statistics graph and dimension corresponding to each
device is same with percentage of absolute value of device value for the sum total of whole absolute
value. It is able to display for 2~8 of devices.
28.1 BASIC FUNCTION
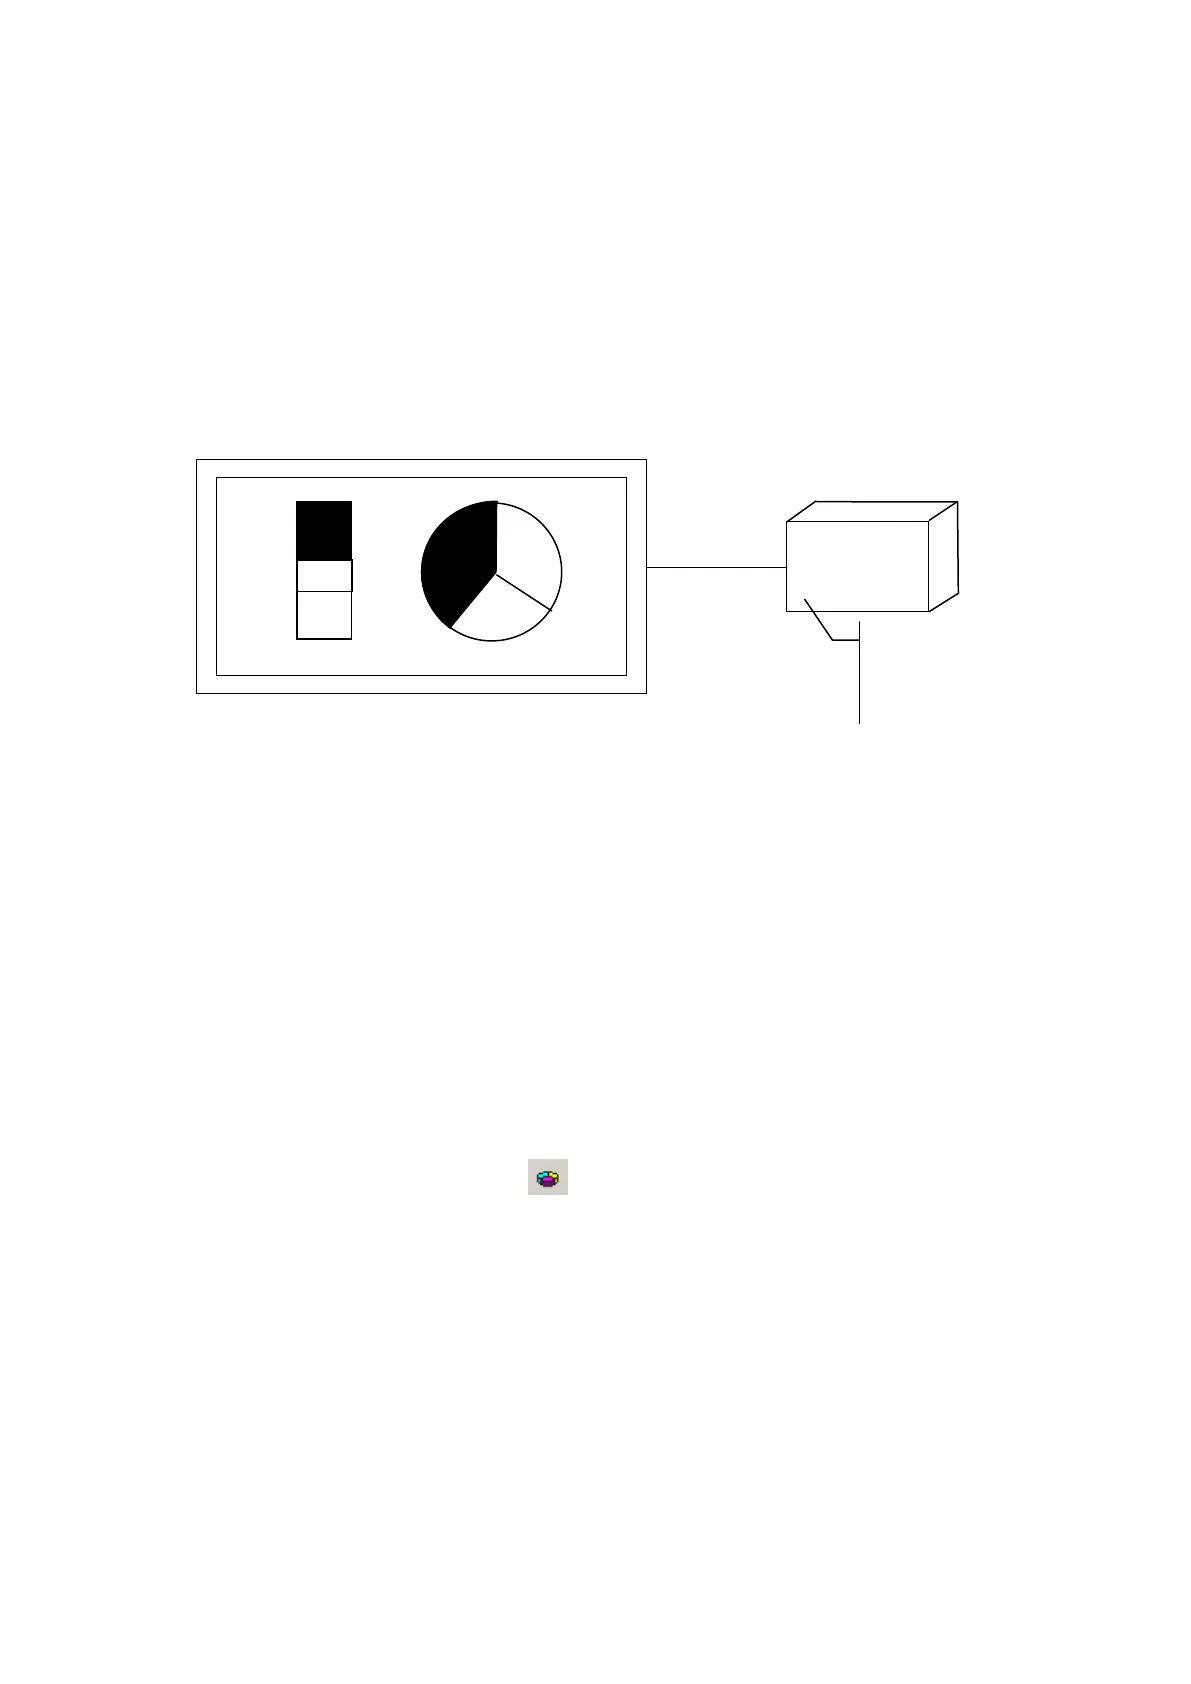
The above figure indicates rectangle and circle type of statistics graph according to device value when
monitor device is configured as D100, D101, D102.
The dimension of graph is divided as a percentage of 30:20:40 when
D100=30,D101=20,D102=40.20:40.
It is able to designate base direction among the bottom side or left for rectangle statistics graph. For
upper direction, it is displayed from the bottom to upper and left to right for right direction, appropriate
area for each device is allotted and displayed from lead device. Circle type of statistics graph has
same diameter of regular circle and it displays device value as a percentage for the sum total of all
device value with clock wise based on 12 o’clock.
28.2 STATISTIKCS GRAPH EDIT PROCEDURE IN EDITOR
(1) Select [Draw]-[Statistics graph] or in toolbar, statistics graph property window is popped
up.
(2) Designate graph type (Rectangle/Circle) in base tap of property window and the number of
partition.
(3) Designate monitor device, color of each partition data type in division tap.
(4) Press OK button, statistics graph is created and adjust as proper size.
GP
PLC
D100=30
D101=20
D102=40
Rectangle type
Circle type
D100=30
D101=20
D102=40
D100=30
D101=20
D102=40
 Loading...