248
27. BAR GRAPH
It displays saved value in designated device as bar graph.
27.1 BASIC FUNCTION
• Display the value from reference value to device current value designating max/min/reference
value.
• Min.size is 16x16 dot.
• Display 3 dots inversing in the opposing side of start scale of bar to display reference display.
• Draw a oblique line when device value is out of the max/min.range.
27.2 BAR GRAPH EDIT PROCEDURE IN EDITOR
(1) Select [Draw]-[Line/Trend/Bar] or in tool bar, Line/Trend/Bar property window is popped
up.
(2) Select bar in basic tap.
(3) Designate direction of graph in form tap.
(4) Designate monitor device and data type in monitor device tap.
(5) Designate value of reference, high limit, low limit of graph in case tap.
(6) Press OK button, bar graph tag is created on a screen.
(7) Adjust proper size.
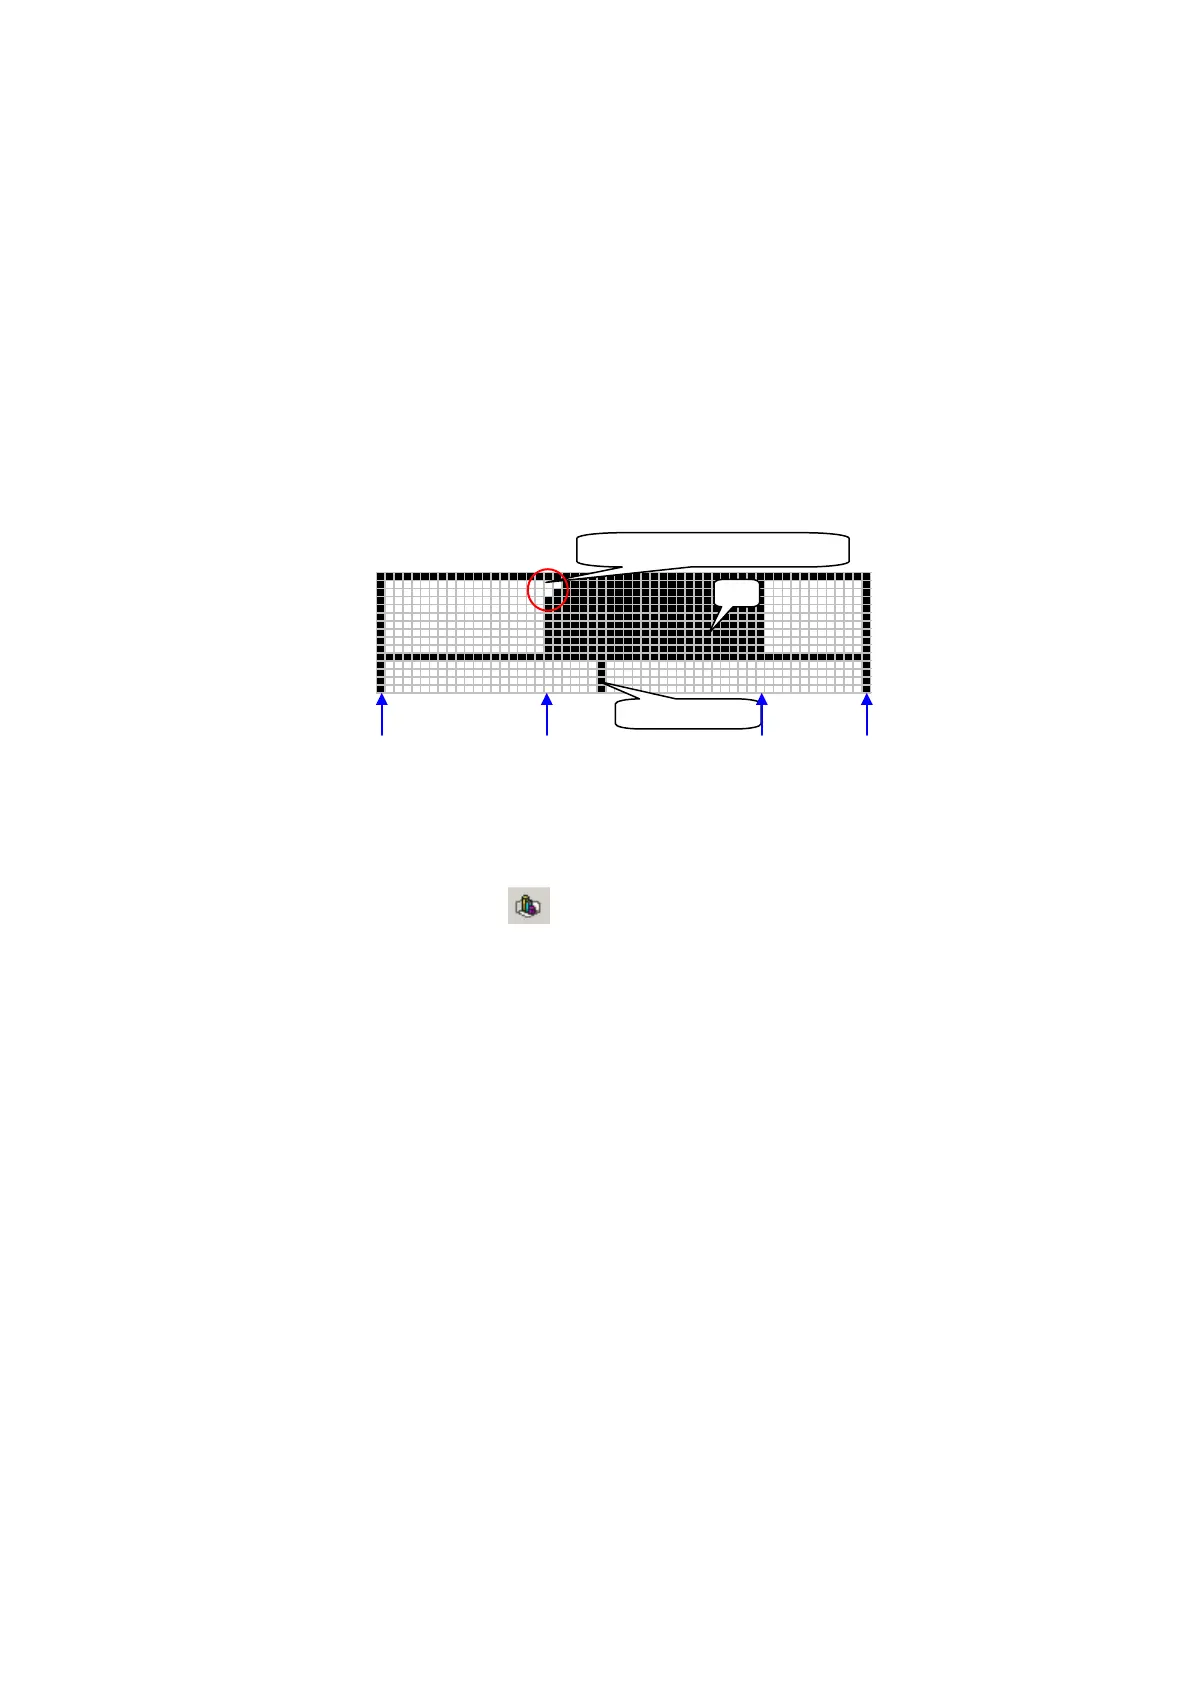
Reference point display
Scale display
Min.value
Reference point
Current value
Max.value
 Loading...