Wireless Access Point
116 Viewing Status on the Wireless AP
IAP Monitoring
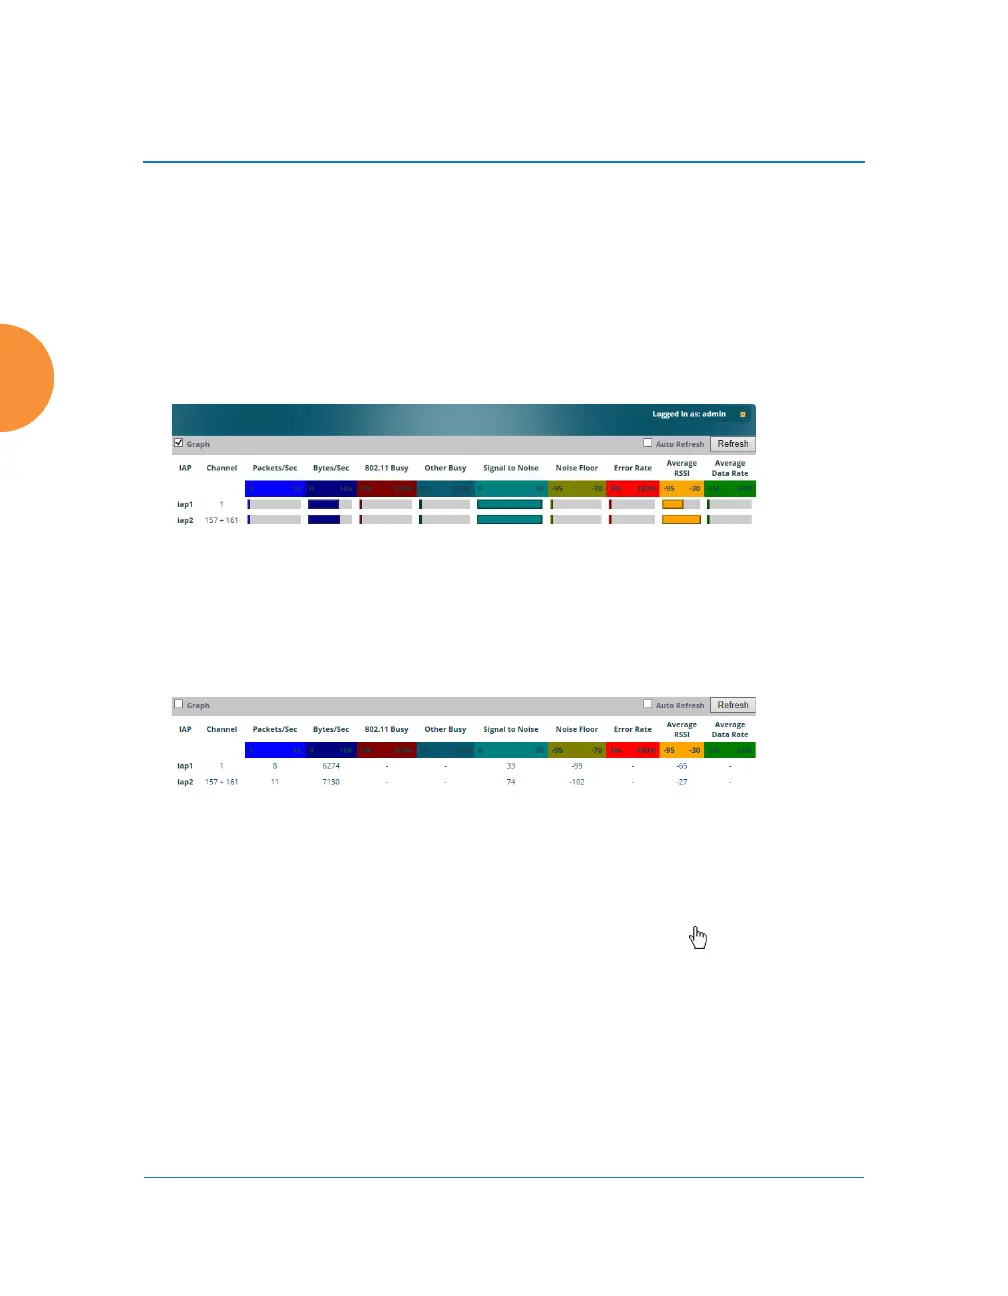
The RF Monitor — IAP Monitoring window displays traffic statistics and RF
readings observed by each AP IAP (radio). Note that the data is an instantaneous
snapshot for the IAP — it is not an average or a cumulative total. To graph these
values over time for a particular channel, see “Channel History” on page 122. For
detailed information on the measurements displayed, please see “Spectrum
Analyzer Measurements” on page 119.
Figure 62. RF Monitor — IAPs
Figure 62 presents the data as a graphical display, enabled by selecting the Graph
checkbox on the upper left. If this option is not selected, data is presented as a
numerical table.
Figure 63. RF Monitor — IAPs
You may sort the rows based on any column that has an active column header,
indicated when the mouse pointer changes to the hand icon . Click Refresh to
update the information at any time. Click Auto Refresh to instruct the AP to
refresh this window automatically.
 Loading...