Wireless Access Point
122 Viewing Status on the Wireless AP
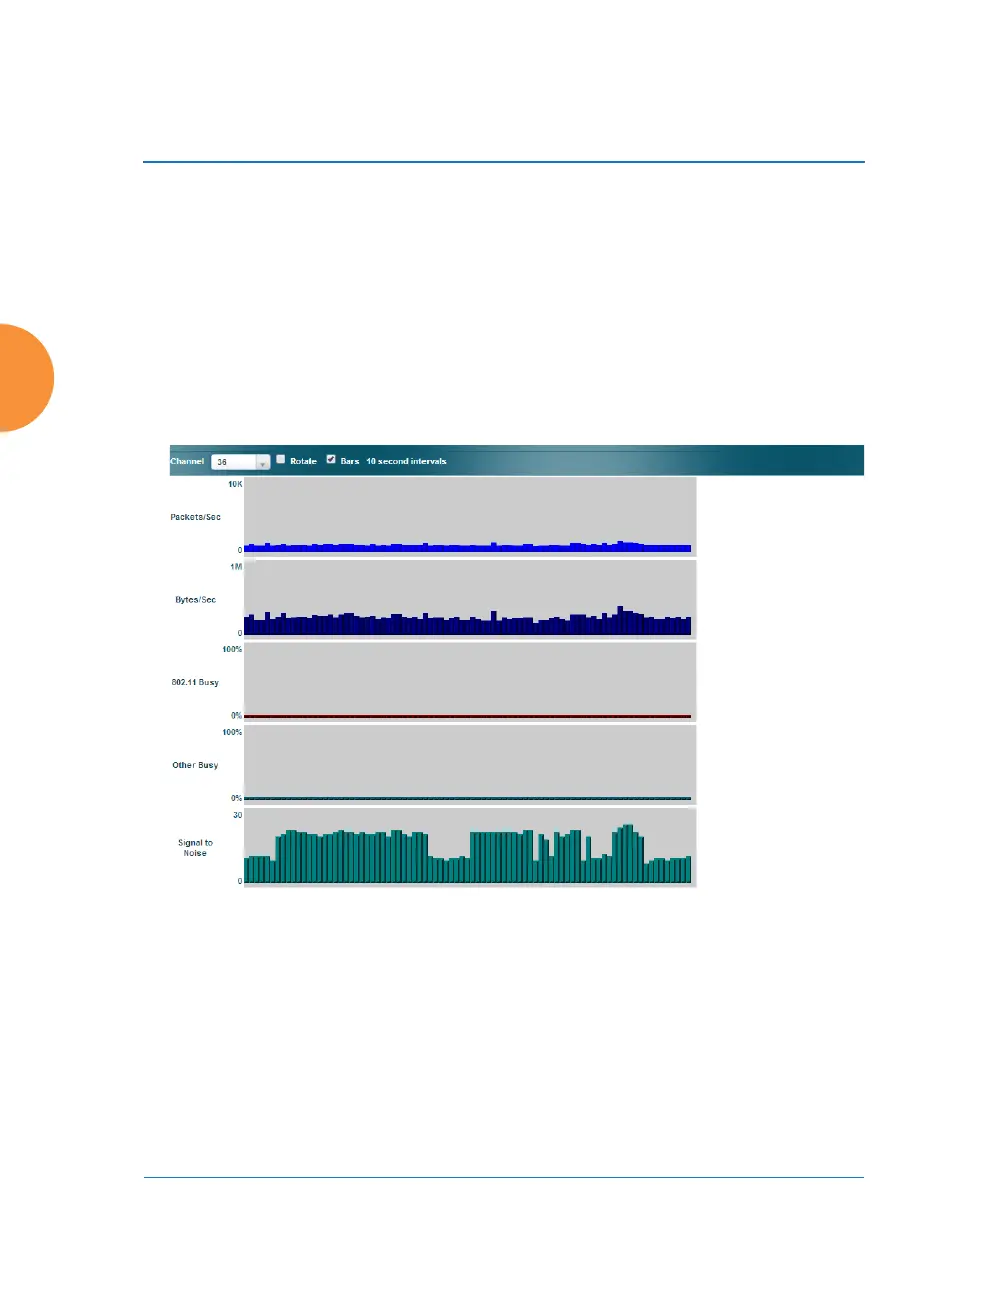
Channel History
The RF Monitor — Channel History window focuses on traffic statistics and RF
readings observed for just one channel that you select in the Channel field. A new
set of readings is added every 10 seconds for a 5 GHz channel, or every 5 seconds
for a 2.4 GHz channel. For descriptions of the measurements displayed, please see
“Spectrum Analyzer Measurements” on page 119.
Figure 66. RF Monitor — Channel History
Figure 66 presents the data in graphical form. New data appears at the left, with
older readings shifting to the right. To make the data appear as a bar chart, click
the Bar checkbox which will shade the background.
You also have the option of clicking the Rotate checkbox to give each statistic its
own column. In other words, the graph for each statistic will grow down the page
as new readings display at the top. (Figure 67)
Channel History is not available for APs or Access Points featuring
802.11ac IAPs.
 Loading...