Point User Guide 369
Standard reports
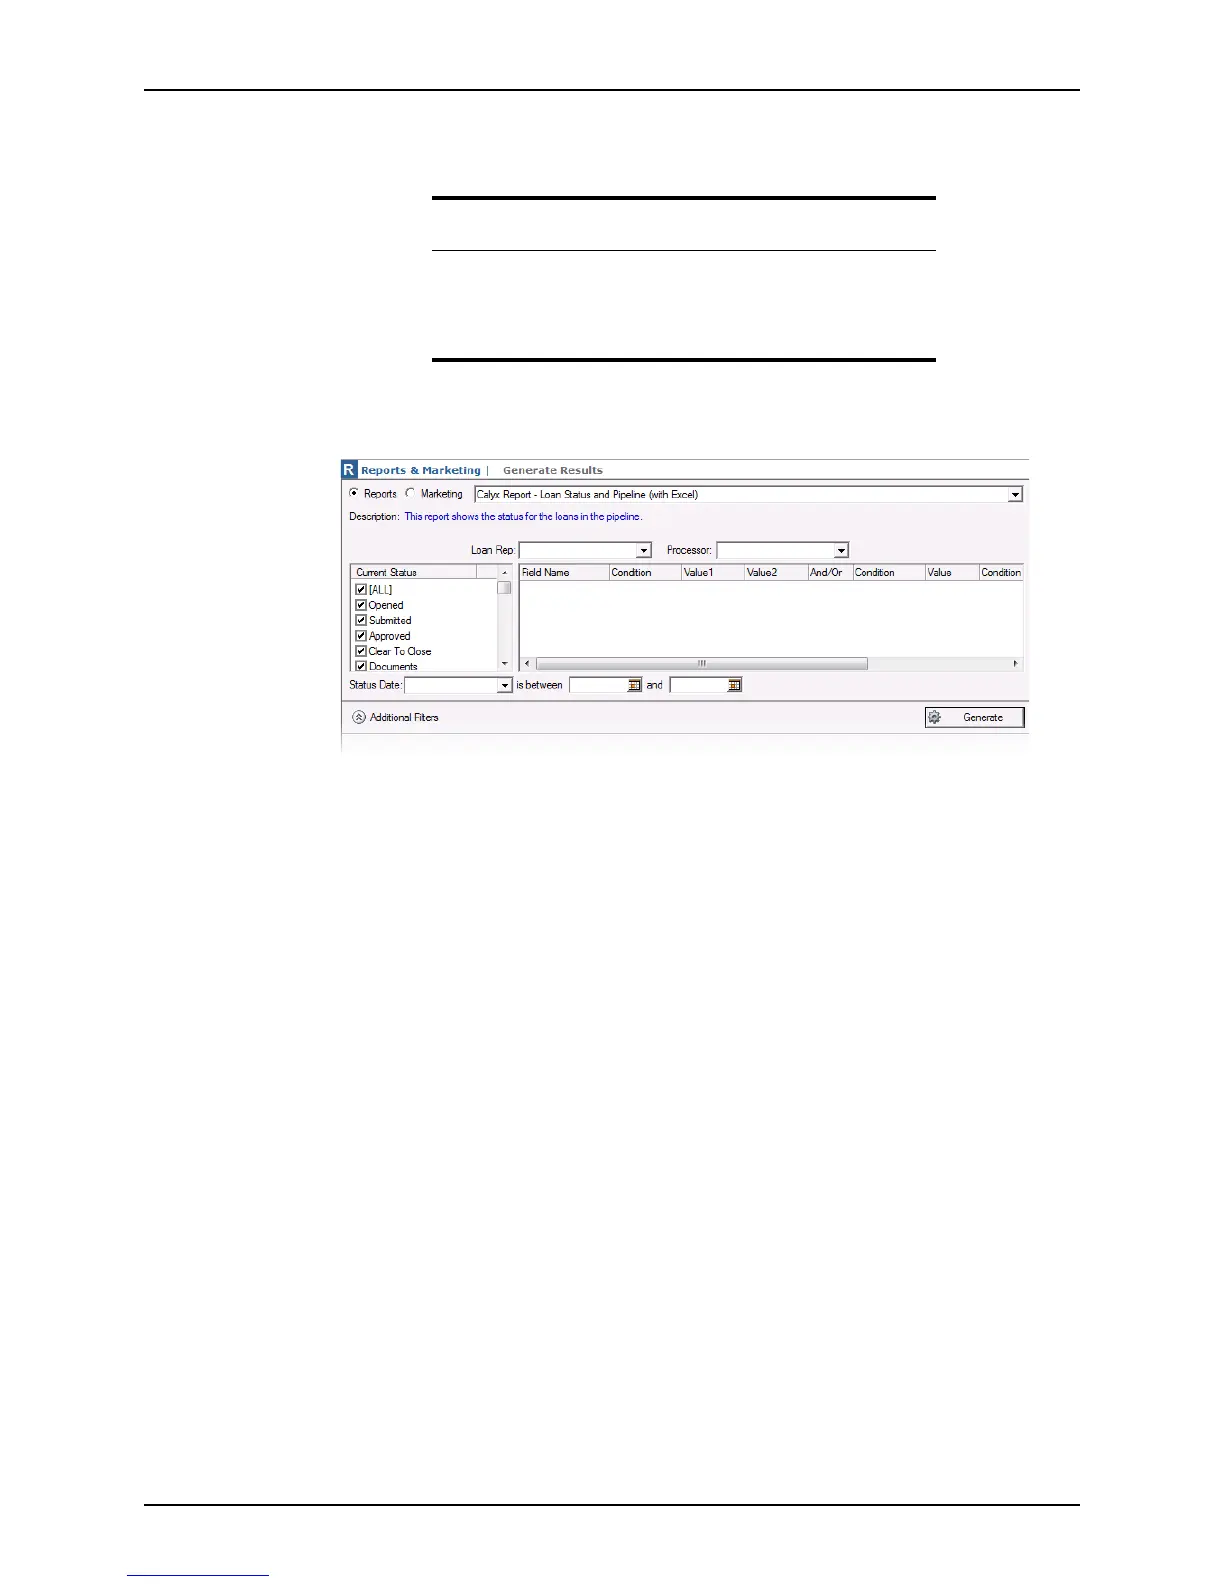
4 In the workspace, select the Reports tab to specify the type of output, and select a
template from the dropdown list.
5 Use the Additional Filters button to toggle the additional filters open to specify more
options to customize the report, or close to expand the generated report.
6 Use the Loan Rep and Loan Processor dropdown lists to filter the search results by a
specific loan representative or loan processor.
7 In the
Current Status section, select the status of the loans to include in the report, or
select
All to include loans of any status.
8 To filter only loans that were in a certain status during a specific time period, select a
loan status from the Status Date dropdown list and specify a date range in date fields.
9 Click Generate.
Depending on the template settings, reports are output to the
Point Report Viewer,
a separate Excel spreadsheet, or an Excel spreadsheet which is displayed in the
lower section of the
Generate Results screen.
Note
The reports that contain “Excel” in the title are generated in a Microsoft
Excel spreadsheet. These reports display in the lower portion of the
Generate results screen.
Click the Open in Excel button to open the report in an Excel file.