Instructions for use Zeus Infinity Empowered SW 2.n 219
Monitoring
SpO
2 screen display
Zeus IE displays SpO
2 saturation values and the
pulse rate in the SpO2 parameter box. The appro-
priate curve field represents the SpO2 curve (pulse
plethysmogram).
Additionally after touching the Display all button
(prerequisite: Display all button has been config-
ured, see page 332):
– Currently set alarm limits
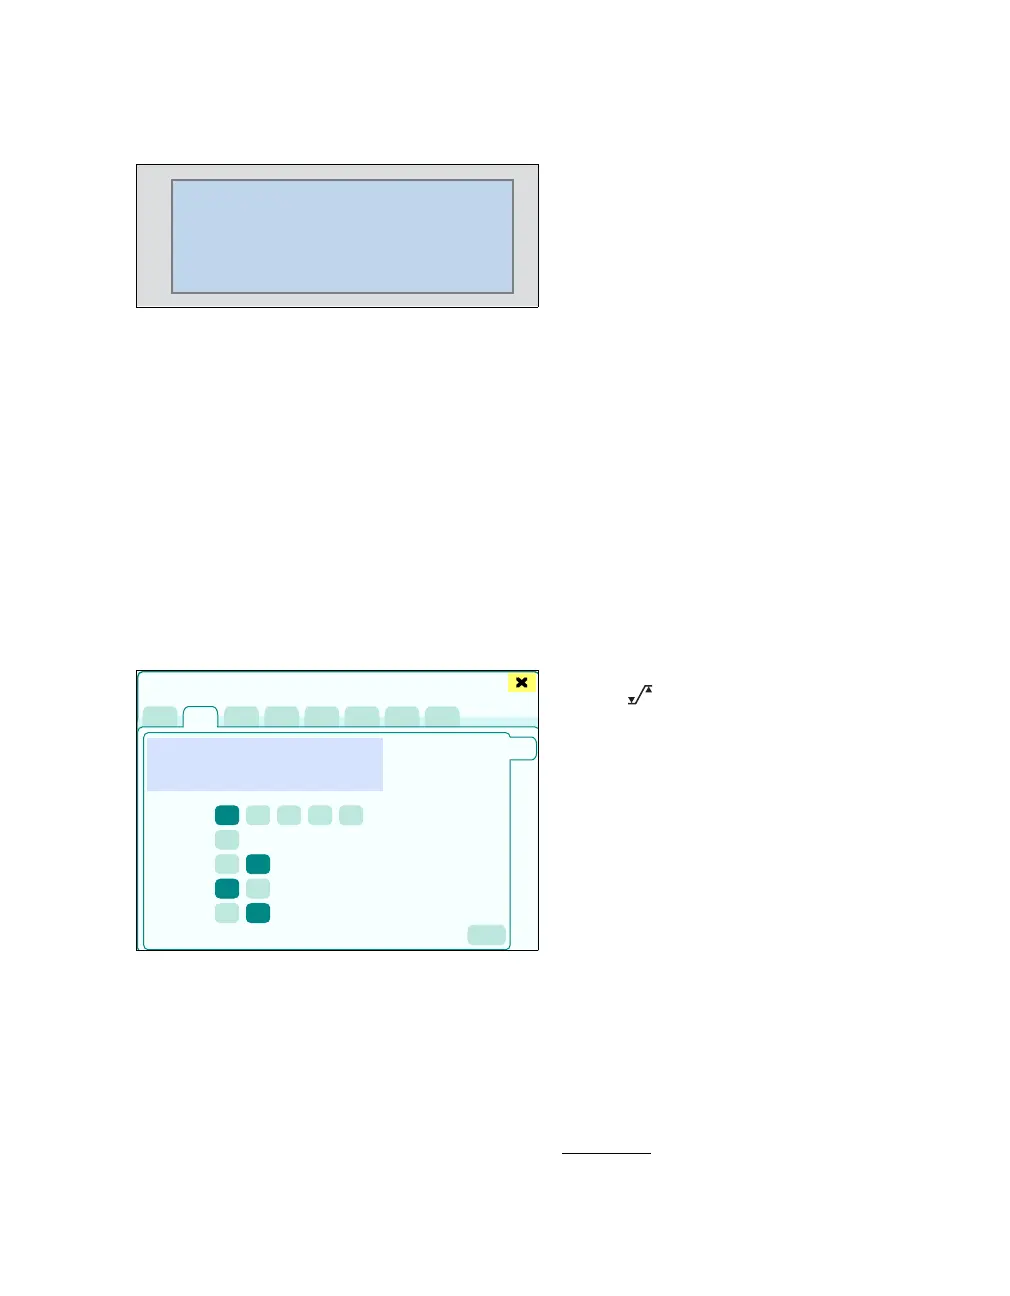
Settings on Zeus IE
z Touch the SpO2 tab (A).
The dialog window for SpO
2 monitoring appears.
This page displays:
B The current SpO2 curve (plethysmogram)
C Plethysmogram scale: Scaling of the SpO2
curve in relation to the amplitude
D Pulse tone volume [%]
E SpO
2 averaging: Fast, Normal
Normal:
– Using Masimo-SET: On average, 8 seconds
– Using Nellcor OxiMax: On average,
8 seconds
– Using MultiMed*: 90 % of the SpO
2 change
is displayed within 30 seconds (this setting
is less susceptible to artefacts, however
alarm messages occur more slowly).
Fast:
– Using Masimo-SET: On average, 2 to
4 seconds
– Using Nellcor OxiMax: On average, 2 to
4 seconds
– Using MultiMed*: 90 % of the SpO
2 change
is displayed within 15 seconds (this setting
is more susceptible to artefacts, however
alarm messages occur more quickly).
F Pulse tone modulation (depending on the sat-
uration rate): On, Off
G NIBP interlock: On, Off
Switches SpO
2 alarms off during an NIBP
measurement. The SpO
2 value is frozen and
displayed in gray for the duration of NIBP meas-
urement.
H The button opens the Alarms > Alarm lim-
its > Noninvasive dialog window for alarm limit
setting.
Test note and accuracy of the blood oxygen me-
ter (Oxymeter)
To comply with the ISO 9919 standard, do not
check the measurement accuracy of the blood oxy-
gen meter (Oxymeter) with a functional test unit or
a patient simulator.
222392
99
67
100
90
SpO2
%
PLS
Sensors/Parameters
A
B
C
D
E
F
G
H
* optional for measurement without SpO2 SmartPod